Figures & data
Table 1. Demographic and clinical characteristics.
Table 2. Performance on the flanker task.
Table 3. Associations between PRMQ and SMBQ levels and flanker task performance.
Table 4. Regions showing significant activation in the incongruent relative congruent interference contrast.
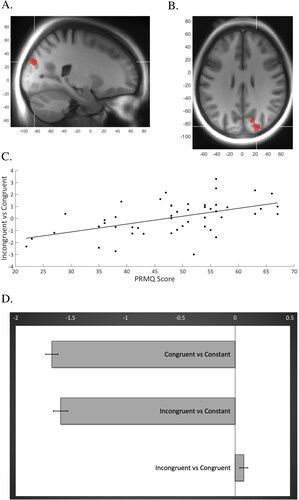
Figure 1. Cluster showing a positive correlation between beta weights and PRMQ-score when contrasting incongruent and congruent Flanker trials. (A,B) Sagittal and axial views of the cluster (x = 22, y = −84, z = 28; t = 4.22) comprising the right superior occipital gyrus and cuneus. (C) The regression analysis revealing a significant positive association between beta weights of this cluster for the incongruent vs congruent contrast (y-axis) and PRMQ score (x-axis), R = 0.27, p =.0001. (D) The additional analysis showing differences in beta values of the same cluster (x-axis) when contrasting the two task conditions (i.e. the incongruent and congruent trials, respectively) to the session constant, indicating lower neural activity during task compared to mean session activity. The bar furthest down in the chart displays the difference in beta values when contrasting incongruent vs congruent trials.