
Figures & data
Figure 1. Schematic illustration of the procedure. Saliva cortisol (SC) was collected five times at baseline, before the TSST, and after the TSST 0 min/15 min/30 min. Note: Heart rate (HR) and electrodermal activity (EDA) were recorded eight times for 5 min at baseline, before the TSST, throughout the preparation/speech/arithmetic, and at 0min/15 min/30 min after the TSST manipulation. Two interval estimation tasks were performed before and after the TSST, respectively. H&E: Heart rate (HR) and electrodermal activity (EDA), HRbase(baseline), HRbef (before TSST), HRpre(preparation), HRspe(speech), HRAir(Arithmetic), HR0min(TSST0min), HR15min(TSST15min), HR30min(TSST30min), SC: Salivary cortisol; TSST: Trier Social Stress Test.
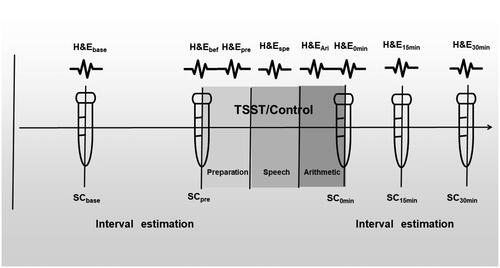
Figure 2. Illustration the paper version of SAM. Note: (a,b) Adapted version of the Self-Assessment Model for potency and arousal ratings. Valence and arousal were rated on a 9-point Likert scale, (a) for emotional pleasantness, where 1 represents the sadness and 9 represents the happiness, and (b) for emotional arousal, where 1 represents the calmness and 9 represents excitement.
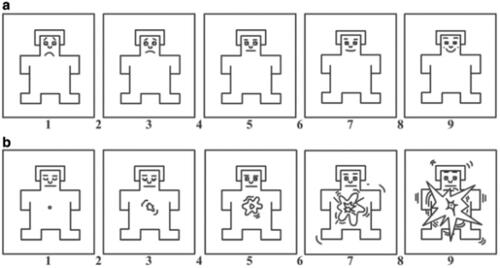
Figure 3. Diagram of the interval estimation process. Note: A fixation cross appears at the center of screen. The participant presses "Z" for left or "M" for right on the keyboard (voluntary condition) or hears a sound of key beep (involuntary condition). The fixation cross disappears followed by a fixed time interval with a feedback tone "left" or "right." The participant was asked to report the time interval by clicking on a 0–1000 ms timeline.
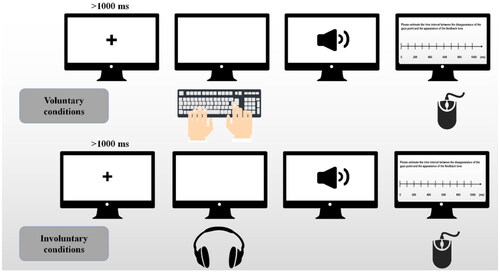
Figure 4. Results of physiological indicators across both groups and times. Note: A represents the results of HR (BPM), B represents the results of SCL, C represents the results of NS.SCRs, and D represents the results of SC (nmol/L). where *represents p < 0.05, **represents p < 0.01. Error bars represent SEM.
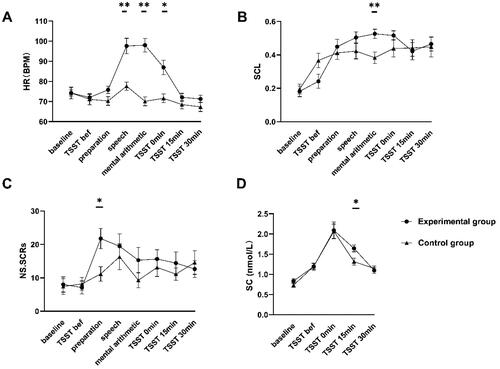
Table 1. Means and standard deviations for HR(BPM) in two groups and the simple effects of group.
Table 2. Means and standard deviations for SCL in two groups and the simple effects of group.
Table 3. Means and standard deviations for NS.SCRs in two groups and the simple effects of group.
Table 4. Means and standard deviations for SC in two groups and the simple effects of group.
Figure 5. Paired t-test for reported time between voluntary and involuntary conditions. It shows that the reported interval for the voluntary condition is significantly shorter than that for the involuntary condition, p < 0.05.
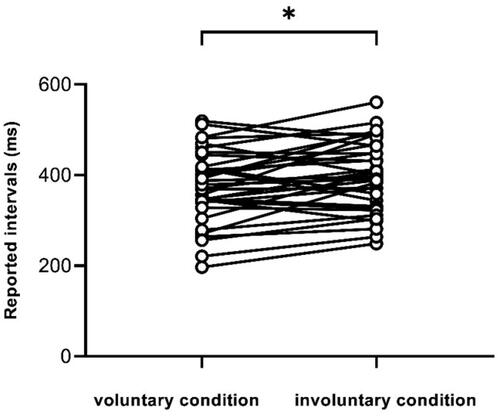
Table 5. The reported intervals for the two groups with different conditions.
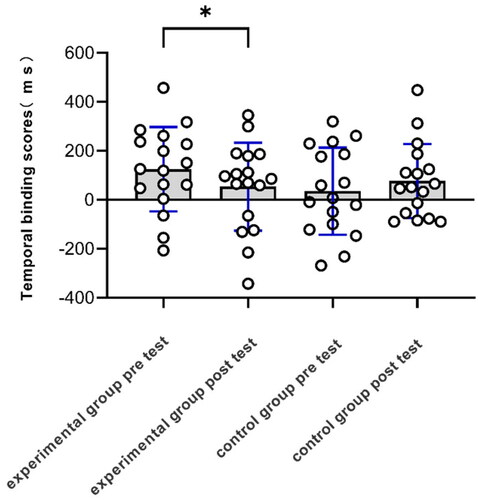
Figure 6. Temporal binding scores for experimental and control groups. Temporal binding scores of the pretest was significantly greater than posttest in the experimental group, while there was no difference in the control group.
Supplemental Material
Download MS Word (19.2 KB)Data availability statement
All raw data obtained in this experiment including questionnaires, physiological measurements and time estimates, and data used for statistical analysis in the article (excluding excluded data), are publicly available on the figshare website: https://doi.org/10.6084/m9.figshare.21758537.v2.