Figures & data
Figure 1. Experimental procedure. Timeline of the experimental procedure in the parent (F0) and offspring (F1 and F2) generations.
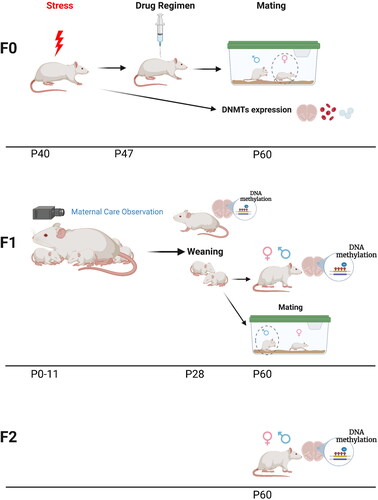
Figure 2. Maternal behavior in control and PRS-exposed dams across assessment days (D1-12). Stress-exposed dams showed less Self Care across drug conditions (a, left and right; n = 10/group), specifically less eating behavior (c). Stress-exposed dams also showed increased Pup Care, regardless of drug treatment (b, left and right; n = 10/group), i.e. more LG (d) and a trend toward more frequent nursing (e). Data presented as means and standard errors, and/or individual values. #p < 0.075. *p < 0.05, relative to Control.
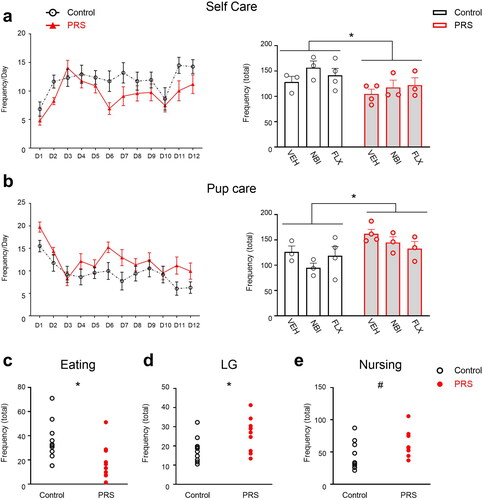
Figure 3. PRS- and drug- induced changes in global DNA methylation in F0, F1 and F2. In F0 (a-c), NBI and FLX treatment increased methylation levels in mPFC (a). In the AMY (b), NBI and FLX increased methylation, as did PRS; PRS effects across drug conditions are depicted to the right of blue dashed line. (c) Methylation levels in mPFC and AMY were positively correlated in both Control and PRS rats. In F1 offspring (d-i), NBI or FLX treatment increased methylation levels in male (d) and female (e) mPFC. In males (d), PRS followed by NBI treatment led to higher methylation than PRS or NBI exposure alone. PRS followed by FLX resulted in control-like methylation levels. In F1 female mPFC (e), PRS marginally increased methylation levels in F1-VEH offspring, and subsequent NBI or FLX treatment amplified this effect. In the AMY of F1 males (f), maternal NBI treatment decreased methylation regardless of PRS, while PRS increased methylation across drug conditions (depicted to the right of blue dashed line). In F1 female AMY (g), PRS had no effect. Maternal NBI treatment decreased methylation regardless of PRS, and maternal FLX increased methylation levels in F1-C but not F1-PRS rats. We found no correlation between mPFC and AMY methylation in F1-C (h), and a negative correlation in F1-PRS (i). In F2 offspring (j-l), we found in the mPFC a trend toward decreased methylation in males, and no effect in females (j). In AMY, we found no effect in males, while F2-PRS females showed decreased methylation levels relative to F2-C (k). We found no correlation between mPFC and AMY methylation in F2-C, and a negative correlation in F2-PRS (l). Data presented as means and standard errors, and/or individual values. #p < 0.075. *p < 0.05. **p < 0.001.
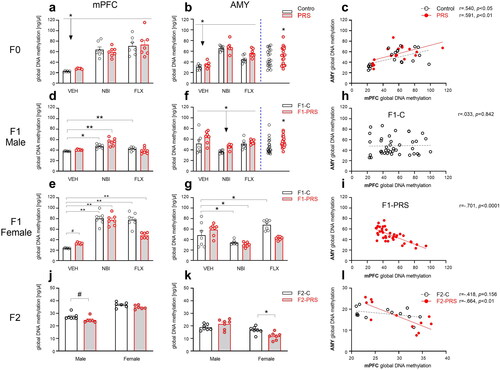
Figure 4. Flow chart illustrating PRS effects on DNA methylation in VEH-treated female rats (F0) and their first- and second-generation offspring (F1 and F2, respectively).
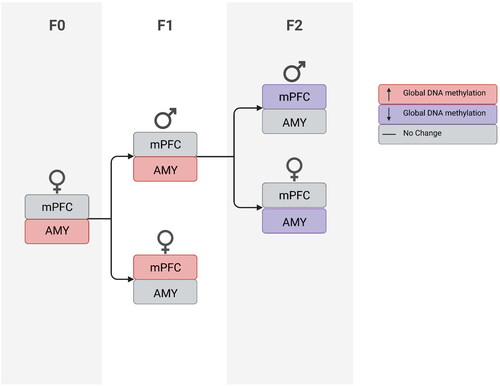
Figure 5. Chronic unpredictable stress in adolescence affects methylation enzyme mRNA expression in adulthood. In mPFC (a), stress increased DNMT1, DNMT3a, 3b and 3 l expression. In AMY (b), stress increased DNMT1 and decreased DNMT3b; a trend toward increased DNMT3l expression was also found. In blood (c), stress increased DNMT1 and decreased DNMT3a, 3b and 3 l expression. In oocytes (d), stress decreased DNMT3b expression. Data presented as means and standard errors. (e) Correlations between DNMT enzyme mRNA levels in mPFC, AMY and Blood of F0 dams. #p < 0.075. *p < 0.05. **p < 0.001.
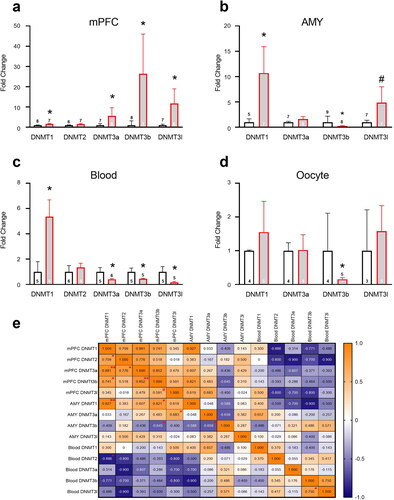
Figure 6. F0 methylation as predictor of methylation levels in F1 and F2 AMY. In the AMY of F1 offspring (a), increased methylation in F0 predicted lower methylation in F1-C, but not F1-PRS rats. (b) increased methylation levels in F0 AMY predicted lower methylation levels in F2 AMY regardless of Group or offspring Sex. Numbers on the X axis reflect the range of values in our dataset.
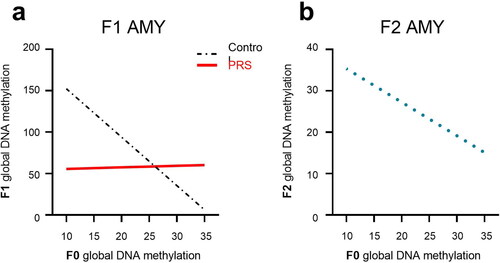
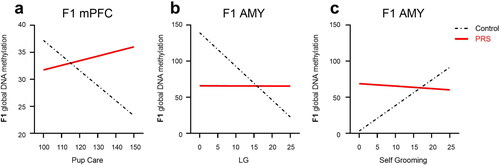
Figure 7. Maternal care as predictor of methylation levels in F1 offspring. In mPFC (a) increased Pup Care predicted lower methylation in F1-C, but not F1-PRS, offspring. In the AMY(b), increased LG predicted lower methylation in F1-C, but not F1-PRS, rats; while increased Self-Grooming (c) predicted higher methylation levels in F1-C, but not F1-PRS, offspring. Numbers on the X axis reflect the range of values found in our dataset.