Figures & data
Figure 1. Experimental groups and UCMS timeline. (A) Mice were assigned to eight experimental groups based on variables of sex, stress, and exercise. (B) UCMS experimental timeline with physiological and behavioral evaluations. MN: male no stress; MNE: male no stress exercise; MS: male stress; MSE: male stress exercise: FN: Female no stress; FNE: Female no stress exercise; FS: Female stress; FSE: Female stress exercise. FCT: Food consumption test; OFT: open field test; NSFT: novelty suppressed feeding test; SCT: sucrose consumption test; FST: Forced swim test; LDT: light dark test; TST: tail suspension test.
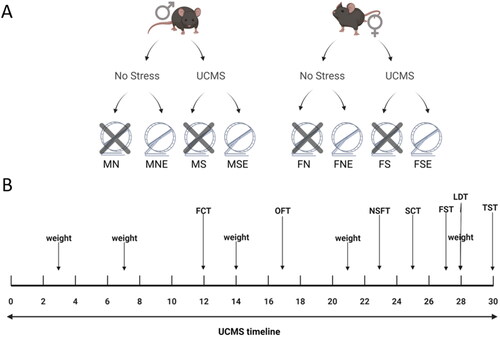
Figure 2. VWR is increased in females and is induced by chronic stress in both sexes. Exercise mice (n = 8 per group) had a 2 h daily access to wheels throughout the 4-week UCMS paradigm. Running sessions were recorded by ANY-maze and VWR parameters were assessed by speedometers attached to wheels. Averages of VWR (A) time, (B) distance and (C) speed of exercise mice were recorded on a daily basis, and weekly averages are plotted above. Error bars represent SEM. A Mixed-effects model analysis was performed on each VWR parameter and revealed significant main effects of stress “*” and sex “α”. The number of symbols reflects significance; three symbols: p ≤ 0.001, four symbols: p ≤ 0.0001.
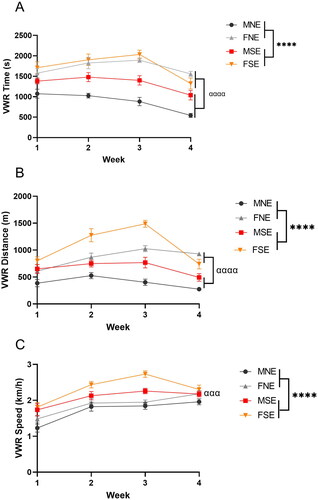
Figure 3. Chronic stress induces weight loss in males and females. (A) male and (B) female mice (n = 8 or 12 per group) were weighed on days 0, 3, 7, 14, 21 and 28 of UCMS and percent change in weight from baseline weight is plotted above. Error bars represent SEM. Male and female data were analyzed separately. The effects of stress and exercise on weight were analyzed by repeated-measures three-way ANOVAs. Significant main effect of stress “*” and exercise “ξ” were identified. One symbol: p ≤ 0.05, four symbols: p ≤ 0.0001. (C) Food intake was measured on day 12. Following an overnight isolation, food was weighed per mouse to determine the amount of food consumed during a routine isolation stressor. Amount of food consumed was normalized to weight. Error bars represent SEM. A three-way ANOVA revealed a significant main effect of stress “*”. One symbol: Bonferroni-corrected p ≤ 0.05.
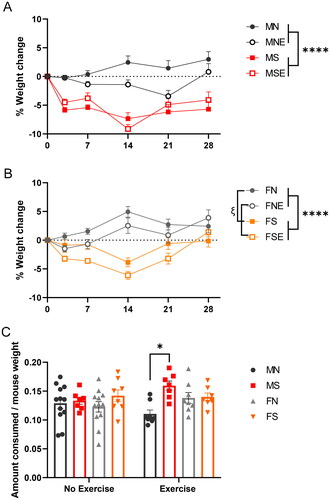
Figure 4. Exercise promotes resilience to hyponeophagia and increases sucrose consumption. (A) NSFT was conducted on day 23 of the UCMS paradigm. Mice (n = 8 or 12 per group) were food-deprived for 24 h prior to test day, during which they were placed for 20 min in a box, with condensed milk solution placed under 2500 lux light in the center of the arena. Latency to first consumption was hand-scored by three blinded researchers and plotted above. Error bars represent SEM. The effects of stress, sex and exercise on latency were analyzed by a three-way ANOVA. Significant main effects of stress (F1,59=27.12, p < 0.0001) and exercise (F1,59=17.82, p < 0.0001) were identified. A Bonferroni post hoc test was then performed, and significant Bonferroni-corrected P values were plotted for stress “*” and exercise “ξ”. One symbol: Bonferroni-corrected p ≤ 0.05, three symbols: Bonferroni-corrected p ≤ 0.001. (B) SCT was performed on days 25 and 26 of UCMS. After several episodes of water restriction 4, 14, and 19 h before testing, mice (n = 8 or 12 per group) were given access to a 1% sucrose solution for 1 h. On the following day, testing was repeated with water instead of sucrose. Sucrose consumption was recorded and normalized to water consumption and body weight. Error bars represent SEM. The effects of stress, sex and exercise on sucrose consumption were analyzed by a three-way ANOVA. Significant main effects of stress “*” and exercise “ξ” were identified. Two symbols: p ≤ 0.01.
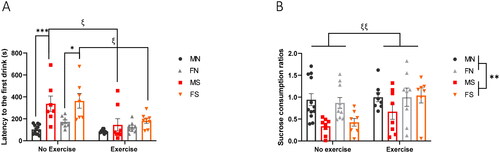
Figure 5. Exercise reduces avoidance behavior in LDT and OFT. The LDT was conducted on days 28 for females and day 29 for males (n = 8 or 12 per group). Mice were individually placed for 15 min in a box consisting of a dark and a light side and were recorded by ANY-maze. (A) Time spent in the light zone, (B) number of head entries to the threshold of the light zone, and (C) number of head entries to light zone were measured and averages are plotted above. Error bars represent SEM. A three-way ANOVA was performed on each of the LDT parameters and revealed significant main effects of sex “α” and exercise “ξ”. One symbol: P ≤0.05, two symbols: p ≤ 0.01, three symbols: p ≤ 0.001, four symbols: p ≤ 0.0001. (D) Mice (n = 8 or 12 per group) underwent OFT on days 17, 18, and 19 of the UCMS paradigm to measure the locomotor activity, exploratory behaviors, and latency to enter an anxiogenic environment. Mice were individually placed for 1 h in a clear Perspex apparatus and latency to enter the center was recorded by ANY-maze. We performed a three-way ANOVA and identified significant main effects of sex (F1,61=6.630, p = 0.0125) and exercise (F1,61=33.95, p < 0.0001) on latency to center entry. A Bonferroni post hoc test was then performed, and significant Bonferroni-corrected P values were plotted for sex “α” and exercise “ξ”. One symbol: p ≤ 0.05, two symbols: Bonferroni-corrected p ≤ 0.01, three symbols: Bonferroni-corrected p ≤ 0.001. (E) Locomotor activity during the OFT was measured by ANY-maze, analyzed by a three-way ANOVA, and plotted above. Error bars represent SEM. The only significant main effect observed was stress “*”. Three symbols: p ≤ 0.001. (F) The bowel movement was assessed by counting mice fecal droppings following the 1-h OFT. The number of fecal droppings was recorded then quantified by ImageJ. A three-way ANOVA revealed significant main effects of stress “*”, sex “α” and exercise “ξ”. One symbol: p ≤ 0.05, three symbols: p ≤ 0.001.
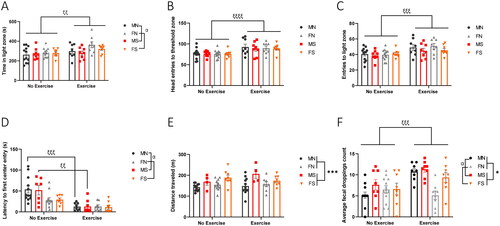
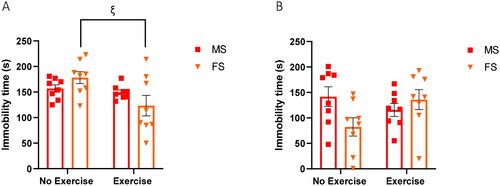
Figure 6. Exercise reduces immobility of female stress mice during a stressor. (A) The TST was conducted on day 30 of UCMS. Stress mice (n = 8 per group) were suspended from their tails from a metal rod for 6 min. The test was video recorded, total immobility time was recorded by three blinded researchers and averages are plotted above. Error bars represent SEM. A two-way ANOVA analysis revealed a significant main effect of exercise (F1, 28= 6.263, p = 0.0184). A Bonferroni post hoc test was then performed, and significant Bonferroni-corrected P values were plotted for exercise “ξ”. One symbol: p ≤ 0.05. (B) The FST was conducted on day 27 of UCMS. Stress mice (n = 8 per group) were individually placed in a plastic cylinder containing 15 cm of water (22–24 °C) for 6 min. The test was video recorded, total immobility time was recorded by three blinded researchers and plotted above. Error bars represent SEM. A two-way ANOVA analysis revealed no significant main effect of sex or exercise, but a significant interaction of exercise × sex was identified (F1, 28= 5.125, p = 0.0315).