Figures & data
Figure 1. Participant selection criteria.
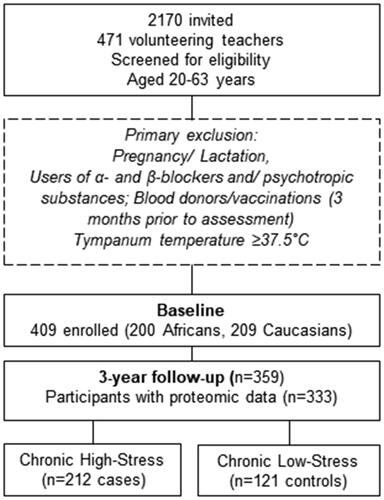
Table 1. Comparing baseline clinical characteristics of the stress-phenotype vs. controls.
Table 2. Changes in neurodegenerative riskmarkers in the stress-phenotype and controls over three years.
Table 3. Multivariate logistic regression analysis was used to explore proteins significantly related to prevalent and incident risk of ongoing brain ischemia (S100B) in the stress-phenotype.
Table 4. Forward stepwise linear regression analyses depicting associations between *retinal hypoperfusion and neurodegenerative risk markers at follow-up considering 3-year changes (3-yr Δ %) in stress-phenotype cases.
Figure 2. Presenting a novel hypoperfusion cut point of 68 mmHg in relation to the stress-phenotype by using a receiver-operating-characteristic curve with AUC [0.72 (0.67, 0.78), p ≤ 0.001] (sensitivity 71%/specificity 64%).
![Figure 2. Presenting a novel hypoperfusion cut point of 68 mmHg in relation to the stress-phenotype by using a receiver-operating-characteristic curve with AUC [0.72 (0.67, 0.78), p ≤ 0.001] (sensitivity 71%/specificity 64%).](/cms/asset/c8ef543d-e5e0-4cee-83dc-880883865916/ists_a_2210687_f0002_c.jpg)
Figure 3. Illustrating assessment of retinal vessel diameter and count in a control eye (); and retinal neurodegenerative risk signs in a stress-phenotype case with ongoing ischemia (S100B ≥0.1μg/L) (). The blue V, indicates veins and the red A, indicates arteries.
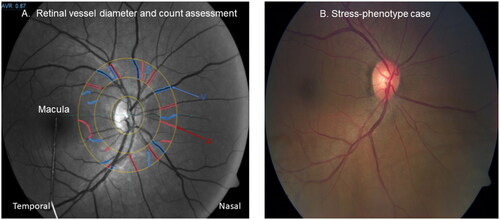
Table 5. Forward stepwise linear regression analyses depicting associations between S100B and neurodegenerative risk markers including retinal data, at baseline, follow-up and 3-year percentage changes (3-yr Δ (%) in the stress-phenotype (n = 160).
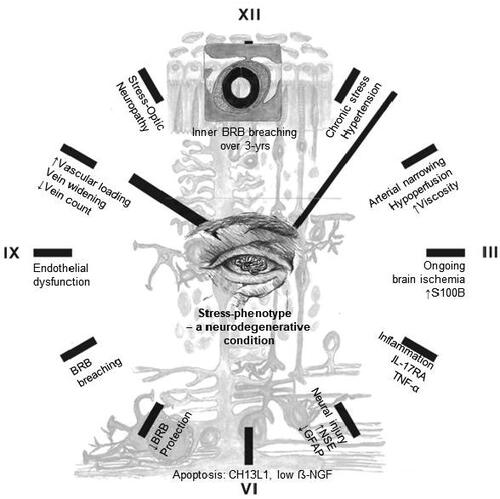
Figure 4. Ticking-clock prognosis of the stress-phenotype as a progressive neurodegenerative condition. Abbreviation: BRB, blood-retinal barrier.