Figures & data
Figure 1. CYLD deficiency leads to an unexpected reaction to acute restraint stress (ARS) in mice. The scheme shows the experimental design using ARS, behavioral test, and c-Fos immunohistochemistry (a). in the EPM, Cyld−/− +ARS mice spent significantly more time in the open arms (B) and made significantly more entries into the open arms (C). in the LDT, Cyld−/− +ARS mice spent significantly more time in the light box (D) and made significantly more transitions (E). Data are represented as mean ± SEM. *, p < .05; **, p < .01; n = 10 mice per group.
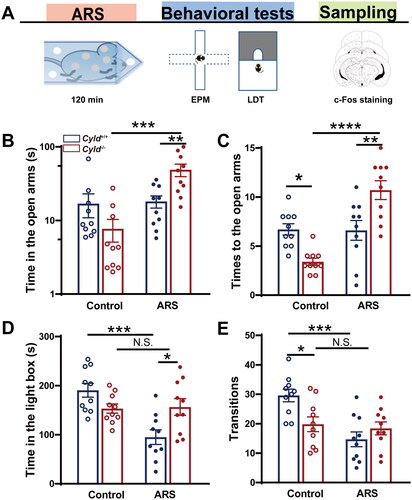
Figure 2. Effect of ARS on c-Fos expression in the mPFC of Cyld−/− mice. Schematic of the mPFC between1.5 and 2.0 mm from the Bregma point. Light blue area: region of mPFC was counted the cell number; Black box: region of representative 200× small images (a). There were significantly more c-Fos-positive cells in the mPFC of Cyld−/− mice subjected to ARS (B). Representative insets show a magnified area within the mPFC of Cyld+/+ mice, Cyld−/− mice, Cyld+/+ +ARS mice, and Cyld−/− +ARS mice (C). Data are represented as mean ± SEM. *, p < .05, ****, p < .0001; control groups n = 6 slice/3 mice; ARS groups n = 10–12 slice/6 mice.
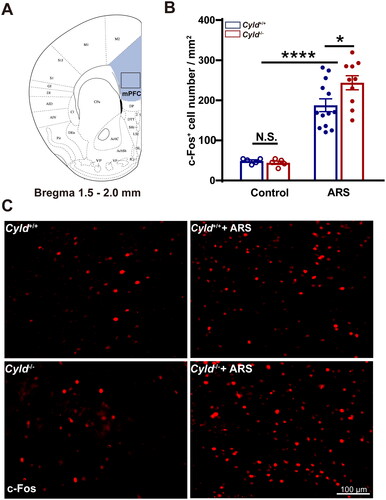
Figure 3. Effect of ARS on c-Fos expression in the DS of Cyld−/− mice. Schematic of the DS between 0 and 1.5 mm from the Bregma point. Light blue area: region of DS was counted the cell number; Black box: region of representative 200× images (a). There were significantly more c-Fos-positive cells in the DS of Cyld−/− mice subjected to ARS (B). Representative insets show a magnified area within the DS of Cyld+/+ mice, Cyld−/− mice, Cyld+/+ +ARS mice, and Cyld−/− +ARS mice (C). Data are represented as mean ± SEM. ****, p < .0001; control groups n = 6 slice/3 mice; ARS groups n = 15 slice/6 mice.
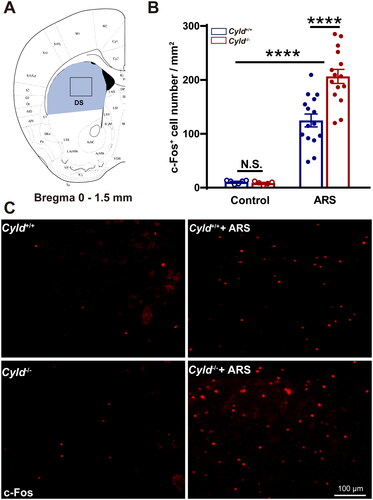
Figure 4. Effect of ARS on c-Fos expression in the NAc of Cyld−/− mice. Schematic of the NAc between 0.6 and 1.9 mm from the Bregma point. Light blue area: region of NAc was counted the cell number; Black box: region of representative 200× images (a). There were significantly more c-Fos-positive cells in the NAc of Cyld−/− mice subjected to ARS (B). Representative insets show a magnified area within the NAc of Cyld+/+ mice, Cyld−/− mice, Cyld+/+ +ARS mice, and Cyld−/− +ARS mice (C). Data are represented as mean ± SEM. ***, p < .001, ****, p < .0001; control groups n = 6 slice/3 mice; ARS groups n = 14 slice/6 mice.
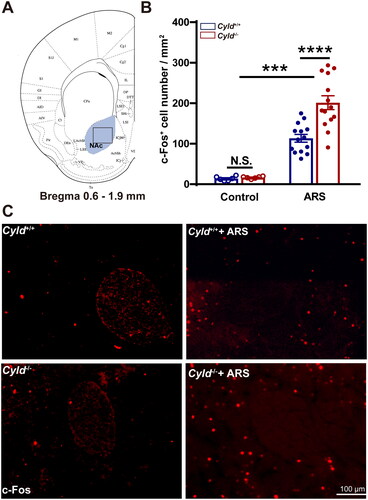
Figure 5. Effect of ARS on c-Fos expression in the BLA of Cyld−/− mice. Schematic of the BLA between −0.8 and −2.0 mm from the Bregma point. Light blue area: region of BLA was counted the cell number; Black box: region of representative 200× images (a). There were significantly more c-Fos-positive cells in the BLA of Cyld−/− mice subjected to ARS (B). Representative insets show a magnified area within the BLA of Cyld+/+ mice, Cyld−/− mice, Cyld+/+ +ARS mice, and Cyld−/− +ARS mice (C). Data are represented as mean ± SEM. *, p < .05, ****, p < .0001; control groups n = 6 slice/3 mice; ARS groups n = 10 slice/6 mice.
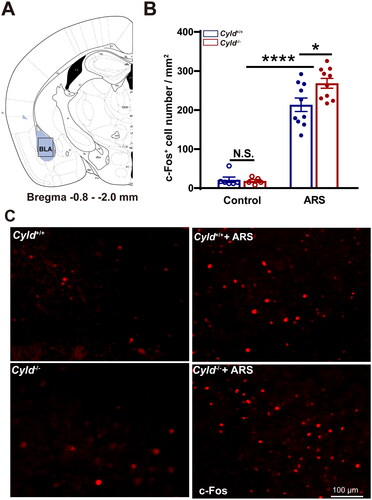
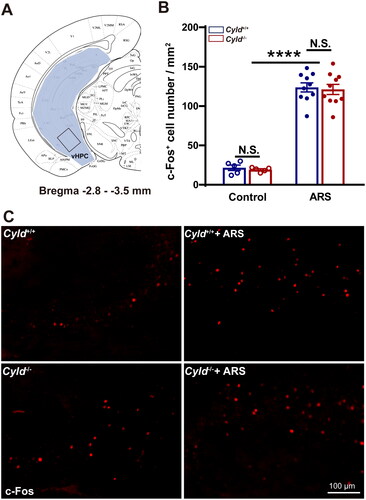
Figure 6. Effect of ARS on c-Fos expression in the vHPC of Cyld−/− mice. Schematic of the vHPC between −2.8 and −3.5 mm from the Bregma point. Light blue area: region of vHPC was counted the cell number; Black box: region of representative 200× images (A). There were significantly more c-Fos-positive cells in the vHPC of Cyld−/− mice subjected to ARS (B). Representative insets show a magnified area within the vHPC of Cyld+/+ mice, Cyld−/− mice, Cyld+/+ +ARS mice, and Cyld−/− +ARS mice (C). Data are represented as mean ± SEM. N.S., not significant, ****, p < .0001; control groups n = 6 slice/3 mice; ARS groups n = 10 slice/6 mice.