
Figures & data
Figure 1. Overview of the included POSEIDON study waves: the flow diagram indicates the number of subjects participating in the POSEIDON study at the T1, T4, T5a and T5b time points, along with the number of samples that were included in the statistical analysis.
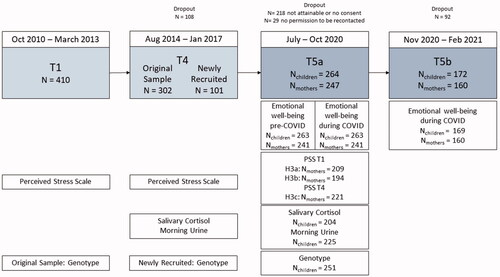
Table 1. Descriptive statistics.
Figure 2. Mean levels and range of emotional well-being (CRISIS score) of the children at all three assessed time points. Significant differences in post hoc tests ****p < .001; *p < .05.
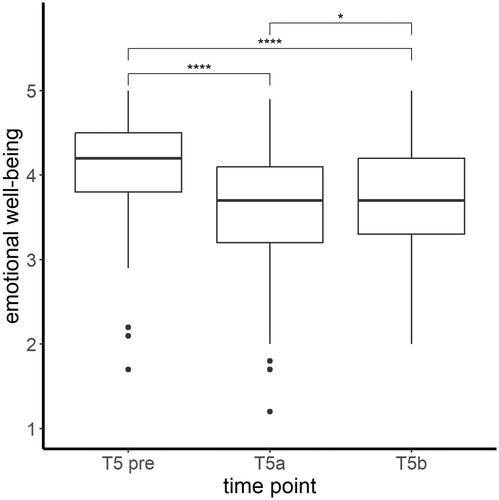
Figure 3. Mean levels and range of emotional well-being (CRISIS score) of the mothers at all three assessed time points. Significant differences in post hoc tests ****p < .001; ns = not significant.
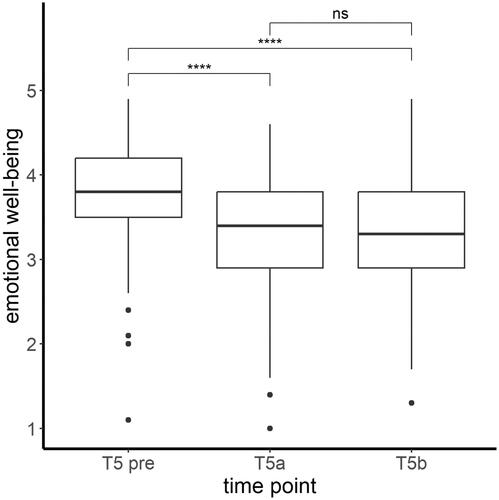
Table 2. Parameter estimation to predict change in the child’s emotional well-being.