
Figures & data
Figure 1. A Representation of experimental timeline. (A) Guinea pig pups received no surgery or injections (UN), or surgery to implant telemetry devices and two injections of saline and saline (SS), low dose ephedrine and saline (LES), low dose ephedrine and cortisol (LEC), high dose ephedrine and saline (HES), or high dose ephedrine and cortisol (HEC) prior to isolation on the day after injection and at a comparable age for non-injected pups. (B) Guinea pig pups were treated with saline vehicle (VEH), or low dose propranolol (LP), or high dose propranolol (HP), prior to first isolation. They were then isolated again without injection 1 and 4 days later.
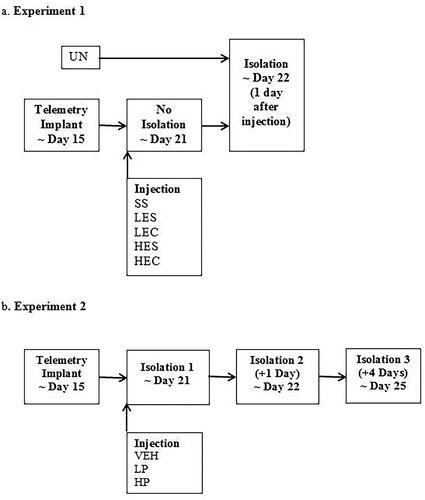
Table 1. Mean (standard error) for vocalizations, depressive-like behavior, core temperature (°C), and activity for Experiment 1.
Figure 2. Mean (A) core temperature and (B) activity across the 12, 15-min Time blocks for Experiment 1. Vertical lines indicated standard errors of the means. N’s = 10-12/Condition. The effect of Time Block was significant for core temperature, p < 0.001.
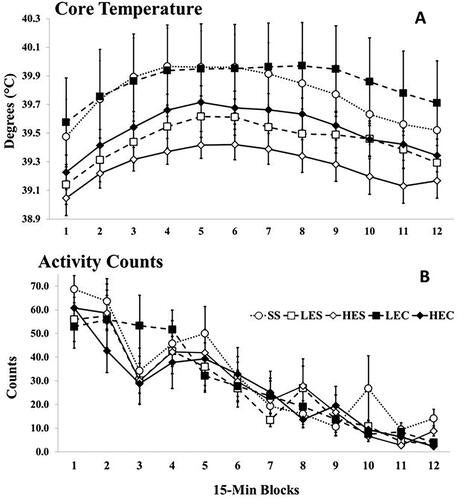
Figure 3. Mean number of vocalizations across isolations in Experiment 2. Guinea pig pups treated with high dose propranolol (HP) showed significantly reduced vocalizing during the first isolation. N’s = 13 or 14/Condition. Vertical lines indicate standard errors and dots illustrate individual values. * p < 0.05 vs VEH.
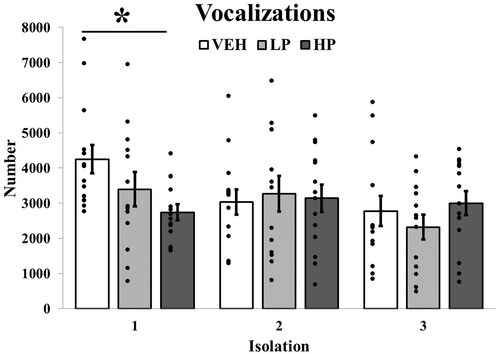
Figure 4. Mean number of 1-min intervals in which the depressive-like measures of (A) crouch and (B) full passive were Observed across isolations. Vertical lines indicate standard errors. N’s = 13 or 14/condition. The overall pattern of increasing behavior with repeated isolations was significant for both measures, p’s < 0.001.
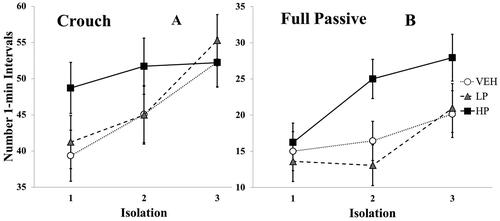
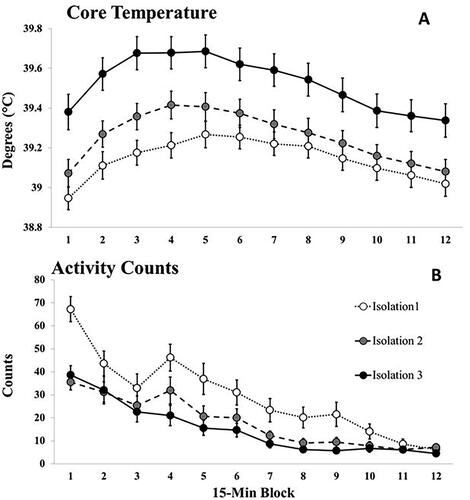
Figure 5. Mean (A) core temperature and (B) activity counts across the 12, 15-min Time blocks for the three isolations of Experiment 2. Data points represent averages across drug conditions (N’s = 41/isolation). Vertical lines indicate standard errors of the means. The Isolation × Time Block interaction was significant for core temperature, p < 0.001.
Data availability statement
The data that support the findings of this study are available from the corresponding author, MBH, upon reasonable request.