Figures & data
Figure 1. Sex difference in darting behavior is decreased by LBN rearing. (A) Number of mice in each group during conditioning and recall. Mice were randomly assigned to control or limited bedding rearing at birth. The number of mice per group was randomly established. (B) Depiction of conditioning protocol. (C) Image of a mouse darting during a tone presentation (top), the per cent of mice that darted at least once during conditioning for all foot-shock intensities tested (middle), and the percent of mice that darted at least once during memory recall for mice conditioned at different foot-shock intensities (bottom). (D) fear conditioning and recall test for control-reared (left) and LBN-reared (right), male and female mice. N per group ranged from 12–23 mice (exact n shown in A). For panel C (bottom), data is presented as the total percent of mice of each sex and rearing condition. For panel D, data is presented as mean ± SEM. *p < 0.05, **p < 0.01, ***p < 0.001.
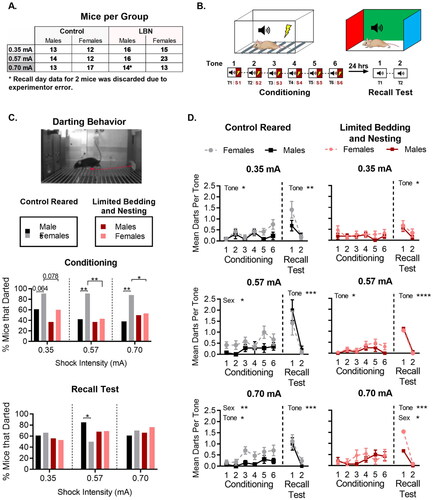
Figure 2. Traditional freezing measurements do not reveal sex differences in control or LBN-reared mice. Freezing curves for auditory cue conditioning and recall test comparing control male and female mice conditioned at low (0.35 mA), medium (0.57 mA), and high (0.70 mA) foot-shock intensities for (A) control reared and (B) LBN reared mice. Individual tone data is shown for freezing during foot-shock conditioning and recall tests. N per group ranged from 12–23 mice (exact n shown in ). Data is presented as mean ± SEM. *p < 0.05, **p < 0.01, ***p < 0.001.
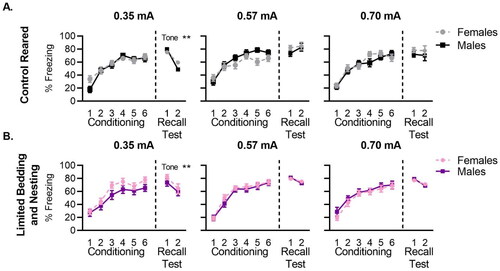
Figure 3. Shock reactivity increases as foot-shock intensity increases. (A) Image of a mouse reacting to a foot-shock. (B) Mice, across all groups, react with a higher velocity to 0.57 and 0.70 mA when compared to 0.35 mA. (C) In control-reared mice at the higher shock intensities, males show a shallow decline compared to females in the magnitude of responding across successive tone-shock pairings (D) for LBN-reared mice, males and females show similar changes in behavioral response to successive shocks at 0.35 mA and 0.70 mA, with males showing a slightly shallower decrease in shock responding at the 0.57 mA intensity. N per group ranged from 12–23 mice (exact n shown in ). Data is presented as mean ± SEM. *p < 0.05, **p < 0.01, ***p < 0.001.
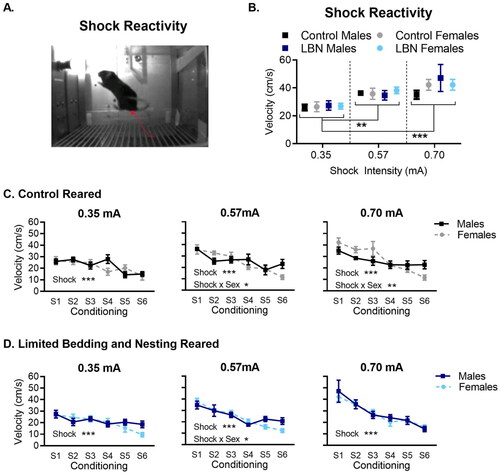
Figure 4. Darting behavior tends to be negatively correlated with freezing behavior. (A) Spearman correlation matrices for control and LBN-reared male and female mice during conditioning. A negative correlation between darting and freezing behavior was observed for control-reared females, LBN females, and LBN males. LBN females also showed a significant negative correlation between foot-shock reactivity and freezing. N per group control females = 41, control males = 40, LBN females = 51, LBN males = 46. (B) Spearman correlation matrices for control and LBN-reared male and female mice during recall test. A negative correlation between darting and freezing behavior was observed for control-reared females, control-reared males, and LBN females. LBN females also showed a significant positive correlation between foot-shock intensity and darting behavior. Both a Spearman correlation analysis (shown here and in the results section) and a Pearson correlation analysis (results section only) were used to assess the correlations between darting, freezing, foot-shock reactivity (shock reactivity) and foot-shock intensity (shock intensity). For analysis, data from all 3 foot-shock intensities are pooled for all variables. N per group controls females = 41, control males = 40, LBN females = 51, LBN males = 44. Spearman correlations analysis. *p < 0.05, **p < 0.01, ***p < 0.001.
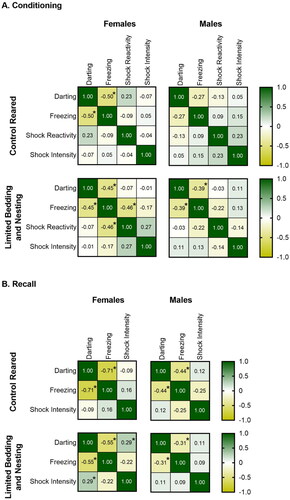
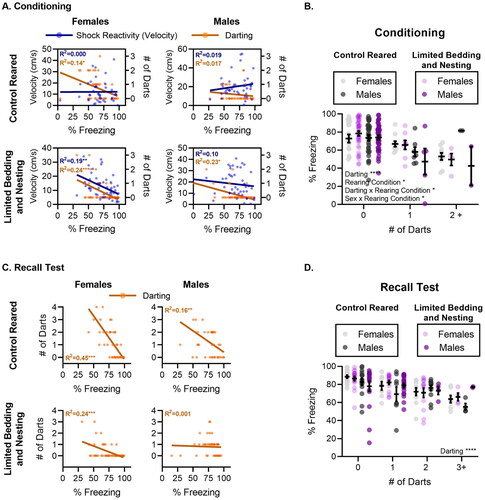
Figure 5. Freezing tends to decrease as darting increases. (A) Scatter plot and linear regression showing the relationship between the velocity of mice in response to foot-shock and their freezing behavior (y-axis), and the relationship between mouse darting behavior and their freezing behavior (right y-axis), during the last tone of conditioning. (B) Graph showing the individual values and the mean values for mice that darted 0, 1, or more than 2 times during the last conditioning tone. The data shows that freezing decreases as darting increases. Significant main effects are displayed in the figure. Individual values are represented by circles, mean and SEM are displayed above individual values. For A and B, N per group are control females = 41, control males = 40, LBN females = 51, LBN males = 46. (C) Scatter plot and linear regression showing the relationship between mouse darting behavior and freezing behavior (y-axis), during the first tone of the recall test. (D) Graph showing the individual and the mean percent freezing for mice that darted 0, 1, 2, or more than 3 times during the first recall tone. The data shows that freezing decreases as darting increases. Significant main effects are displayed in the figure. Individual values are represented by circles and mean and SEM are displayed above individual values. For B and C, N per group controls females = 41, control males = 40, LBN females = 51, LBN males = 44. For analysis, data from all 3 foot-shock intensities are pooled for all variables. For A and C simple linear regression analysis were conducted. For B and D a 3-way ANOVA was used to analyze changes of freezing at different darting levels. *p < 0.05, **p < 0.01, ***p < 0.001.