
Figures & data
Figure 1. High dose of NE induced HT22 cells apoptosis. Flow cytometry analysis and Wes assay were used to evaluate the effect of NE on apoptosis of HT22 cells. (A) Representative images of HT22 cells treated with different concentrations of NE were examined by flow cytometry analysis. (B) The apoptosis rate of HT22 cells upon indicated concentration of NE administration (n = 3, One-way ANOVA, F3,8 = 154.1, p < 0.0001). (C) Expressions of cleaved-Caspase3 and cleaved-PARP in HT22 cells treated with DMSO or NE were detected by Wes assay. (D-F) The relative expressions of cleaved-Caspase3 (D, F3,8 = 686.4, p < 0.0001), cleaved-PARP (E, F3,8 = 39.05, p < 0.0001), and PARP (F, F3,8 = 0.2934, p = 0.8292) proteins were normalized to β-actin (n = 3, One-way ANOVA). ** p < 0.01 vs DMSO.
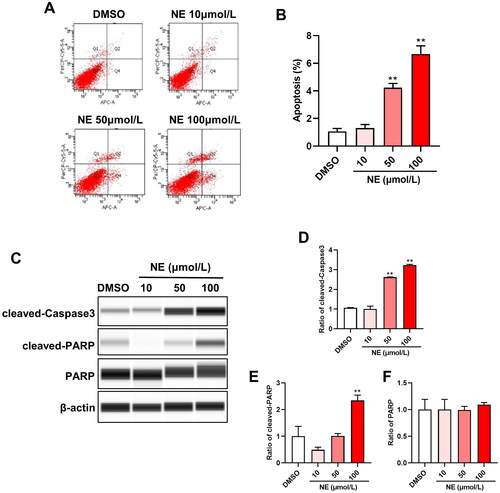
Figure 2. High level of NE-induced MALAT1 expression in HT22 cells. The effect of NE on MALAT expression was quantified by qRT-PCR. (A-C) qRT-PCR assays monitoring expression of MALAT1 in HT22 cells exposed to different concentrations of NE for 12 h (A, F3,8 = 7.459, p = 0.0105), 24 h (B, F3,8 = 10.88, p = 0.0034) and 48 h (C, F3,8 = 10.17, p = 0.0042) (n = 3, One-way ANOVA). * p < 0.05, ** p < 0.01 vs DMSO.
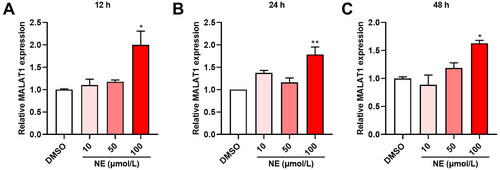
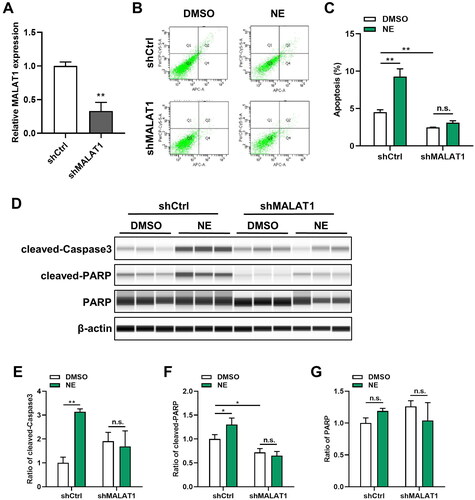
Figure 3. MALAT1 knockdown alleviated NE-induced cell apoptosis. Lentiviruses were used to establish the cell lines with shMALAT1. The levels of MALAT1 and cells apoptosis were detected in the indicated cells. (A) Knockdown of MALAT1 in HT22-shMALAT cells was validated by qRT-PCR (n = 3, student’s t-test, t = 8.241, p = 0.0012). (B) Representative images of flow cytometry analysis for HT22-shCtrl/shMALAT1 cells upon NE (100 μmol/L) or DMSO treatment. (C) The quantified result of cell apoptosis analyzed by flow cytometry (n = 3, Two-way ANOVA, Interaction: F1,8 = 42.83, p = 0.0002). (D) Expressions of cleaved-Caspase3 and cleaved-PARP in HT22-shCtrl/shMALAT1 cells treated with DMSO or NE (100 μmol/L) were detected by Wes assay. (E-G) The relative expressions of cleaved-Caspase3 (E, Interaction: F1,8 = 26.44, p = 0.0009), cleaved-PARP (F, Interaction: F1,8 = 9.891, p = 0.0137), and PARP (G, Interaction: F1,8 = 5.403, p = 0.0486) proteins were normalized to β-actin (n = 3, Two-way ANOVA). *p < 0.05, **p < 0.01, n.s., no significance.
Data availability statement
The data and materials in this paper are freely available from the authors upon request.