Figures & data
Figure 1. Unpredictable stress-induced heart dysfunction.
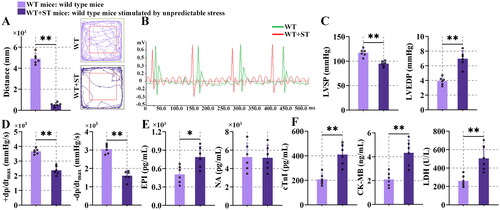
Figure 2. Unpredictable stress causes inflammation and apoptosis.
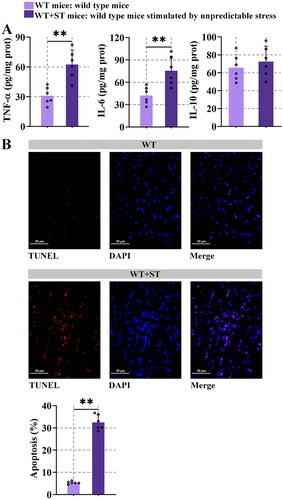
Figure 3. CCK and CCKR were upregulated after unpredictable stress.
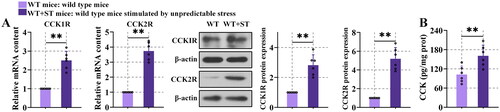
Figure 4. Cardiac function and myocardial injury were ameliorated in CCK1R2R-/- mice.
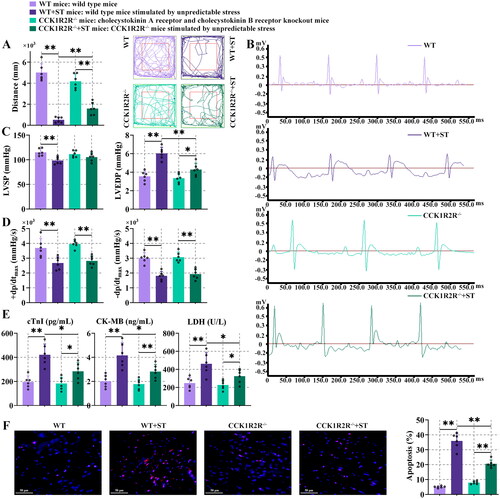
Figure 5. Oxidative stress and inflammation were decreased in CCK1R2R-/- mice.
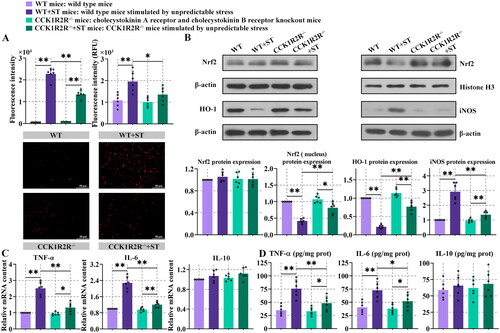
Figure 6. Overall identification of differential metabolites.
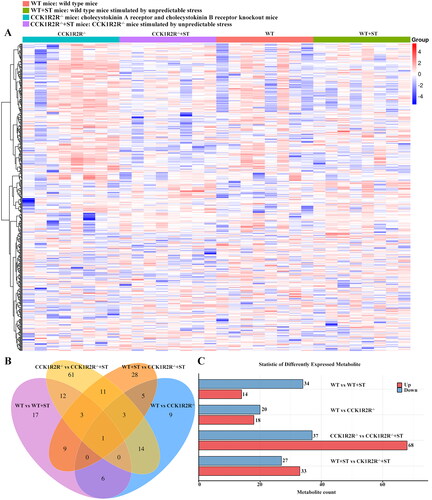
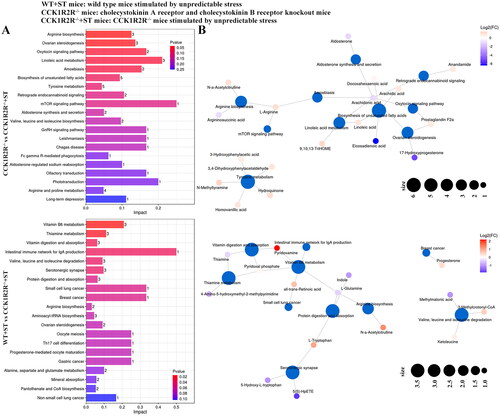
Figure 7. Analysis of differential metabolites between different groups.
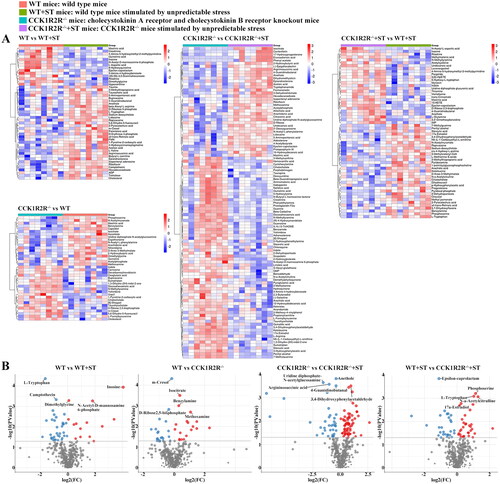
Figure 8. The relative amounts of metabolites (WT vs WT + ST; WT vs CCK1R2R-/-) is shown in Z-score plot.
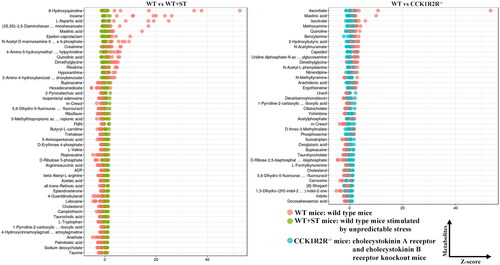
Figure 9. The relative amounts of metabolites (CCK1R2R-/- vs CCK1R2R-/-+ST; WT + ST vs CCK1R2R-/-+ST) is shown in Z-score plot.
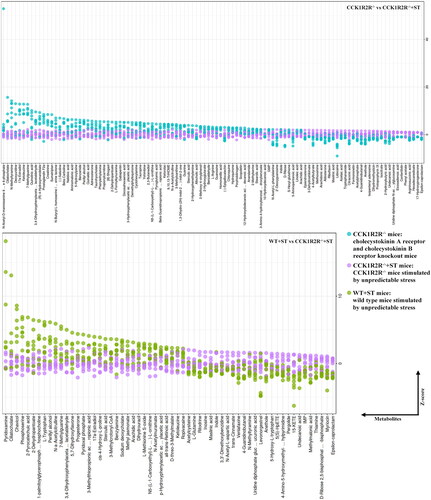
Figure 10. Differential metabolite pathway analysis (WT vs WT + ST; WT vs CCK1R2R-/-).
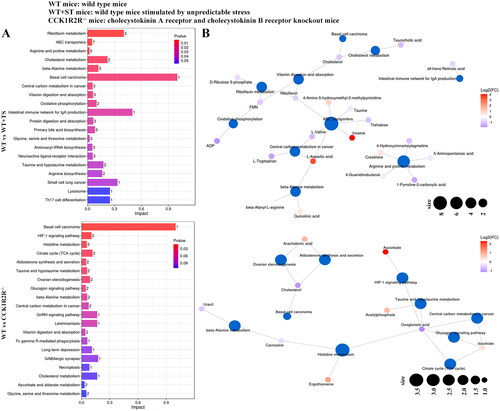
Figure 11. Differential metabolite pathway analysis (CCK1R2R-/- vs CCK1R2R-/-+ST; WT + ST vs CCK1R2R-/-+ST).