
Figures & data
Figure 1. Photomicrographs and graphics representing the connective tissue (shown in blue and pointed by arrowheads) and smooth muscle contents (shown in Pink and pointed by arrows) in the bladder wall of different groups. (A) Control group (B) Stressed group (C) Control + comfort food group (D) Stressed + comfort food group. Sections were stained using Masson’s trichrome and captured under 600× magnification. The higher presence of connective tissue (blue stained areas) indicates tissue fibrosis. (E) Connective tissue surface density, (F) smooth muscle surface density. Asterisks represents statistical differences (p = 0.0005) between stressed and control animals. Scale bar represents 75 µm.
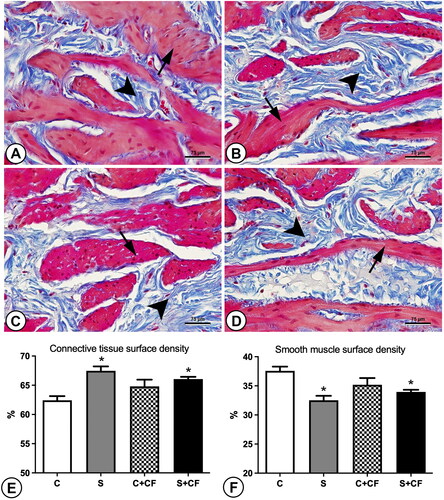
Figure 2. Photomicrographs and graphics representing the elastic system fibers (shown as Fine purple lines and pointed by arrowheads) in the bladder wall of different groups. (A) Control group (B) Stressed group (C) Control + comfort food group (D) Stressed + comfort food group. Sections were stained using Weigert’s resorcin fuchsin and captured under 1000× magnification. (E) Results of elastic system fibers surface density. Asterisks represents statistical differences (p = 0.0013) between stressed and control animals. Hashtag represents statistical differences (p < 0.0001) between comfort food and standard chow fed animals. Scale bar represents 200 µm.
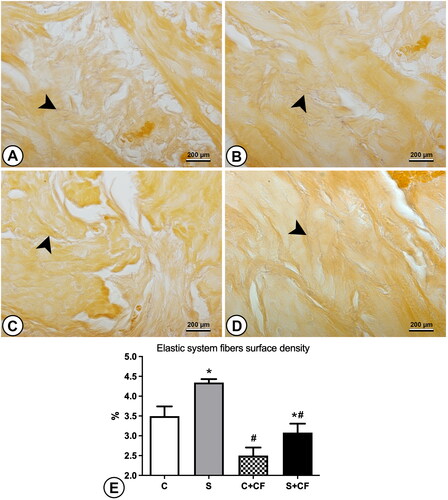
Figure 3. Photomicrographs and graphics representing the epithelial height in the bladder of different groups. The epithelium is marked (in random areas) by double-headed arrows to indicate the differences in epithelial height. (A) Control group (B) Stressed group (C) Control + comfort food group (D) Stressed + comfort food group. Sections were stained using Masson’s trichrome and captured under 600× magnification. (E) Results of epithelial height measurements. Asterisks represents statistical differences (p < 0.0001) between stressed and control animals. Scale bar represents 75 µm.
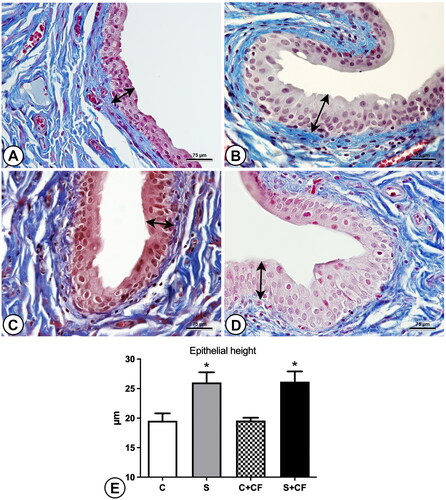
Table 1. Biometric data and bladder morphometric analysis of the experimental groups.