
Figures & data
Table 1. Demographics of subjects included in GICA and LEiDA analyses.
Table 2. Motion parameters of whole sample (N = 20).
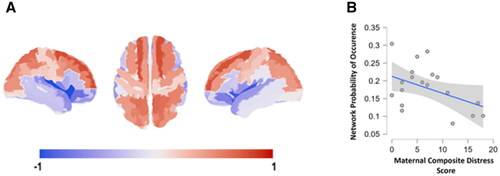
Figure 1. Maternal prenatal distress associates negative with the probability of occurrence of a frontoparietal network: (A) visualization of the brain network #3 identified from clustering solution with 6 clusters; (B) scatter plot of the association between probability of occurrence and PSE (spearman’s rho = −0.659, p = 0.004, Bonferroni-corrected p = 0.024).
Supplemental material
Supplemental Material
Download Zip (3.2 MB)Data availability statement
The Finnish law and ethical permissions do not allow the sharing of the data used in this study.