
Figures & data
Figure 1. Experimental procedure. A timeline presenting a 10-min block of relaxation, followed by a block of practice (with no time specified), a 10-min block of work task and two more 10-min blocks of relaxation. Arrows indicate cortisol collection points after each timed block and survey completion after the first relaxation phase and after the work task.
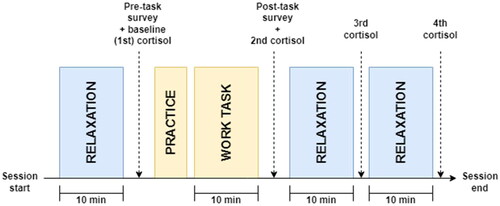
Table 1. Sample characteristics in first session.
Table 2. Self-reported means and standard deviations for each group.
Table 3. Cortisol means and standard deviations for each group.
Figure 2. Mean overall cortisol change levels per subgroup with 95% CI. A boxplot with four bars demonstrating the mean overall change for each payment group-SET combination. The fixed payment-high SET bar has the highest level of overall mean change whereas the PRP-high SET bar has the lowest overall change.
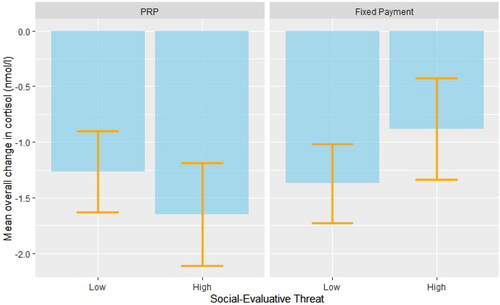
Table 4. Mixed effects regressions for cortisol change outcomes by experimental group.