Figures & data
Figure 1. Taste reactivity test. The X axis depicts the 2s time bins, and the Y axis demonstrates the number of frames in which positive hedonic reactions are elicited (30 frames/second). A) responses to distilled water, and B) responses to salt solution (NaCl 2%). Visual inspection of the plots clearly shows that most behavioral activity after the ingestion of the solutions happened in the first 20 seconds, and even more evidently during the first 10 seconds. GEE analysis of these first 10 seconds revealed a significant effect of time only in the groups that received salt solution (Adlib-salt Wald= 23.169; df= 3; p < 0.001; FR-salt Wald= 45.288; df= 3; p < 0.001). Adlib-salt pups decreased their hedonic responses over time, while FR-salt pups kept exhibiting hedonic responses on a crescendo up until 6 seconds.
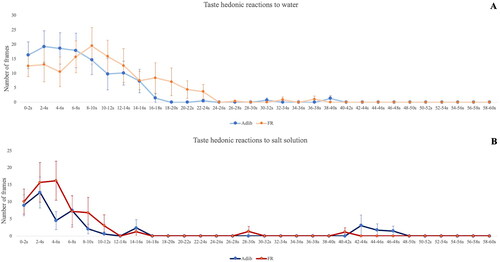
Figure 2. A) µ-opioid receptor and its phosphorylated form in the Nacc of Adlib and FR rats. * µ-opioid and p µ-opioid receptors levels in the Nacc were lower in the FR group when compared to the control group (student’s t-test; µ opioid: t = 3.278, df = 22, p = 0.003; p µ opioid: t = 2.258, df = 22, p = 0.034). n = 12/group. B) Tyrosine hydroxylase (TH) and its phosphorylated form in the Nacc of Adlib and FR rats. No statistically significant differences were seen between the groups. n = 12/group.
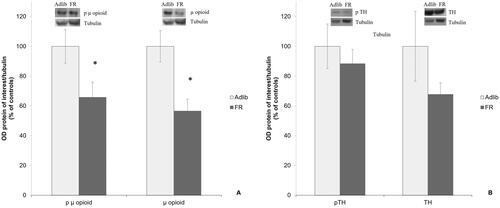
Table 1. Participants’ characteristics in MAVAN.
Table 2. Macronutrients, energy and sodium consumption in the snack test.
Figure 3. Interaction between µ opioid receptor (OPRM1) genetic score and fetal growth on the consumption of sodium during the snack test. Intrauterine growth restricted (IUGR) children consume more sodium as the OPRM1 genetic score decreases. The OPRM1 genetic score had no effect on children with normal birth weight (BW). The difference between IUGR and normal BW is statistically significant to the left of the red line.
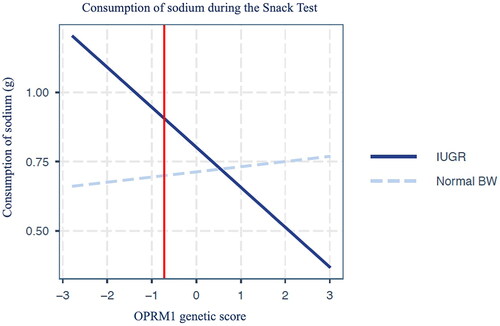
Table 3. Interaction effect between OPRM1 genetic score and quality of fetal environment, as well as main effects of quality of fetal environment and OPRM1 genetic score on nutrients consumption during the snack test.
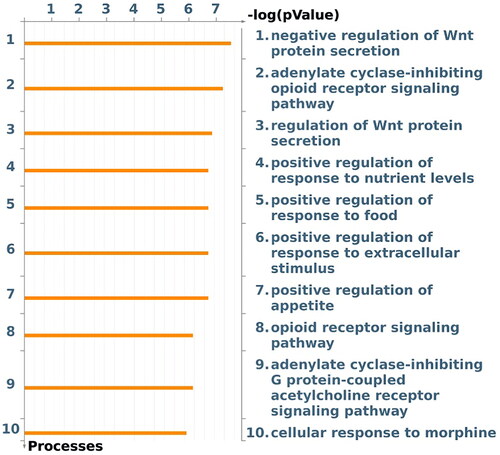
Figure 4. Enrichment analysis of the SNPs that comprise the µ opioid receptor (OPRM1) genetic score using MetaCore®.