Figures & data
Figure 1. (A) Schematic of the experiment timeline. Male and female Wistar rats underwent a mixed modality chronic adolescent stress paradigm consisting of social defeat and restraint or remained non-stressed. Rats received an intraperitoneal injection of saline or LPS every 3 days for 9 weeks. On PND 125, central and peripheral tissues were collected. Weight was monitored throughout the experiment. A history of chronic stress slowed weight gain in males regardless of LPS challenge (B) but did not alter weight in females (C). *p < 0.05. Symbols represent mean ± SEM. Panel A was created using Biorender.com.
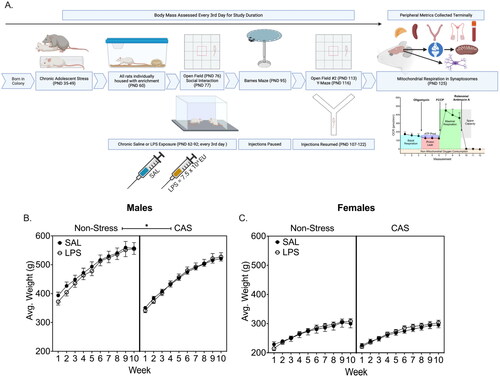
Table 1. Circulating pro-inflammatory (IL-13, IL-1β, IFNγ, TNFα, KC/GRO) and anti-inflammatory (IL-4, IL-5, and IL-10) cytokines were assessed from terminal trunk blood.
Figure 2. In the first open field trial males with a history of chronic adolescent stress (CAS) (A) spent less time in the center and (B) more time in the periphery of the open field while C) mobility was not altered. This assessment was conducted on PND 76 which was over 3 weeks after the last stressor and 2 weeks into the chronic LPS paradigm. Behavioral assessments were conducted 72 h after LPS injection. A second open field assessment was conducted approximately 5 weeks after the first assessment on PND 113. Effects observed in trial 1 were attenuated in trial 2, however, CAS males moved more during trial 2 compared to non-stress males. D-F) Females did not show any changes in open field performance with stress history or LPS challenge in either open field trial. *p < 0.05. Bars represent mean ± SEM.
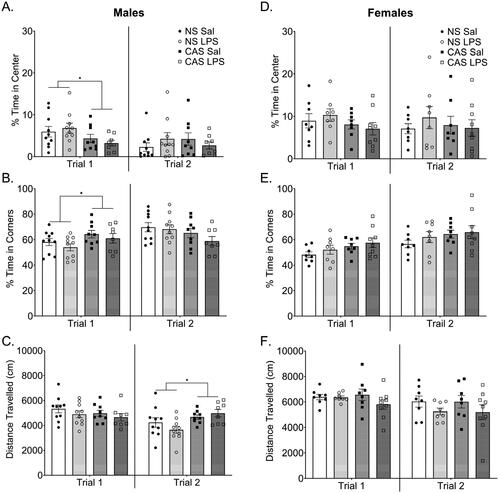
Figure 3. Barnes Maze was conducted starting on PND 95 after 3 weeks of repeated LPS injections. No LPS injections were given during acquisition, probe, or reversal. During acquisition training for the Barnes Maze task there were no changes in summed latency to target (A, B). stress history and LPS exposure history interacted to alter latency to locate the target position during Probe 1 in males (C). Males with a history of stress without LPS exposure history, showed an increased latency to locate the goal box position in Probe 1. In females, previous exposure to repeated LPS increased the latency to locate the goal box position in Probe 1 regardless of stress history. *p < 0.05. Bars represent mean ± SEM.
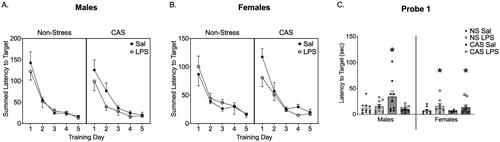
Figure 4. During reversal training for the Barnes Maze task there was not an influence of stress or history of repeated LPS on males (A) or females (B) in the summed latency to target. There were no effects of stress history or LPS history during Probe 2 in either sex (C). Bars represent mean ± SEM.
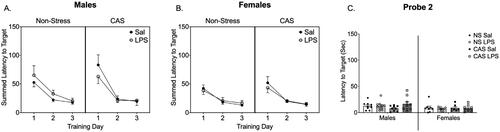
Figure 5. Y-Maze was conducted on PND 116, over 2 months after stressors concluded and 72 h after LPS injection during the 4th week of LPS injections every 3rd day. In both males (A) and females (C) repeated LPS decreased the alternation index in the Y-Maze task regardless of stress history suggesting an impairment in working memory performance. The alternation index is the number of actual alternations based on the number of possible alternations given the total number of arms visited. There were no changes in velocity (B, D). *p < 0.05. Bars represent mean ± SEM.
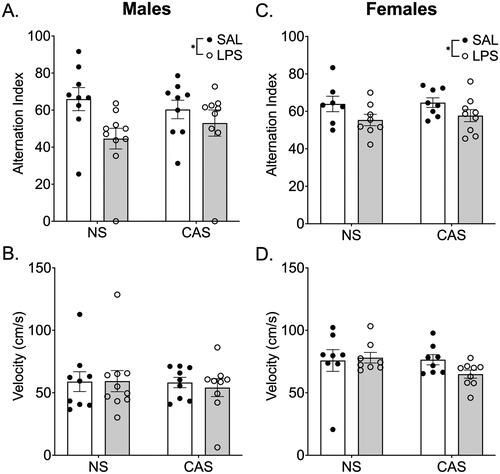
Figure 6. Synaptosomes were collected on PND 122 and 125. This was over 10 weeks after the final stressor and 72 h following the final repeated LPS injection. We collected tissue 72 h after LPS injection in order to reflect mitochondrial function at a timepoint relative to LPS that was similar to the final open field and Y maze assessments. Mitochondrial respiration was not altered by stress history or chronic LPS history in males. A) Overall oxygen consumption rate (OCR) across the measurements of the Cell Mito stress Test. Mitochondrial dynamics, including basal respiration (B), maximal respiration (C), proton leak (D), ATP production (E), and spare capacity (F), were not altered by stress history or chronic LPS exposure. *p < 0.05. Symbols or bars represent mean ± SEM.
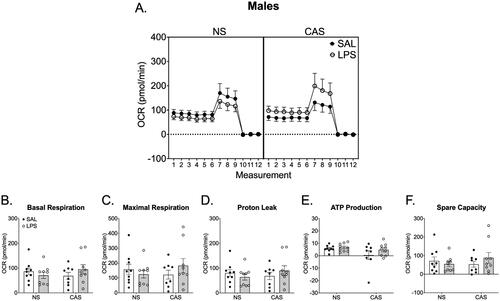
Figure 7. Synaptosomes were collected on PND 122 and 125. This was over 10 weeks after the final stressor and 72 h following the final repeated LPS injection. We collected tissue 72 h after LPS injection in order to reflect mitochondrial function at a timepoint relative to LPS that was similar to the final open field and Y maze assessments. (A) Overall oxygen consumption rate (OCR) across the measurements of the Cell Mito stress Test. (E) ATP production was increased in females following chronic LPS regardless of stress history. Basal respiration (B), maximal respiration (C), proton leak (D), and spare capacity (F) were not altered by repeated LPS exposure or stress history. *p < 0.05. Symbols or bars represent mean ± SEM.
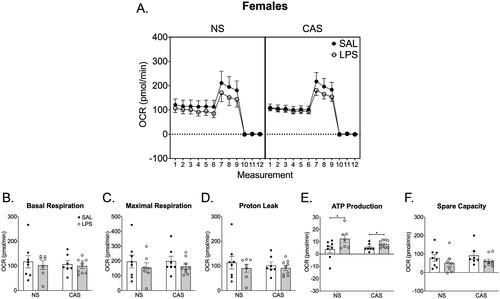
Figure 8. (A) In males, neither stress history nor repeated LPS exposure altered density of the mitochondrial marker Hexokinase 1 or the synaptic marker SNAP25. The ratio of the two markers was similarly not altered. (B) In females, there was an interaction between stress history and repeated LPS exposure on SNAP25 such that non-stress females treated with LPS showed an increase in SNAP25. However, this was not reflected in the ratio of Hexokinase 1 to SNAP25. *p < 0.05. Bars represent mean ± SEM.
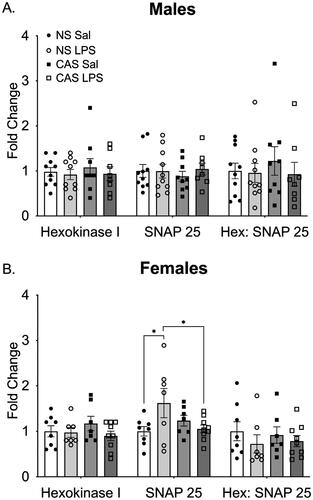
Figure 9. There was no effect of chronic adolescent stress or repeated LPS on microglia total process intersections within the dorsal hippocampus in males (a). There were no group differences observed in total microglia volume in the dorsal (B) or ventral (D) portions of the hippocampus within males. Within the ventral DG region, repeated LPS exposure lowered average total intersections regardless on stress history (C). *p < 0.05. Bars represent mean ± SEM.
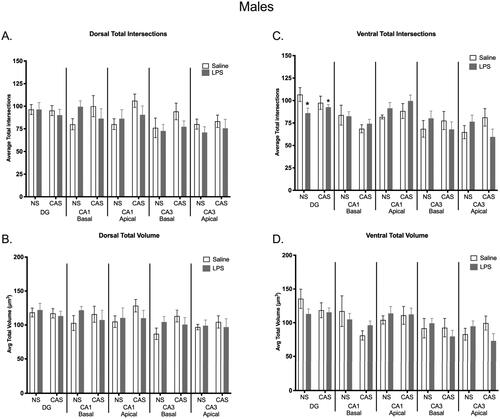
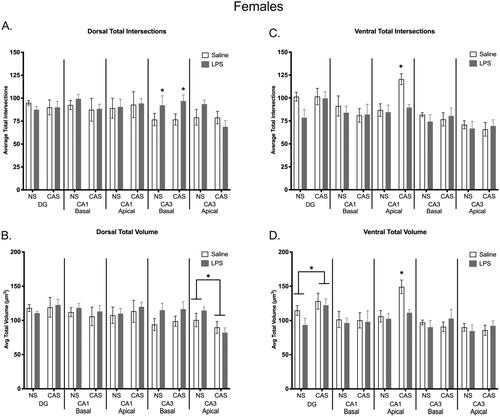
Figure 10. Microglia morphology was shifted in the dorsal and ventral regions of the hippocampus within females. Repeated exposure to LPS increased total number of intersections within the dorsal basal CA3 region (a). A history of chronic adolescent stress increased total intersections within the ventral apical CA1 region, but this effect of stress was not observed when females were also exposed to repeated LPS (C). A history of stress decreased average total volume in the dorsal apical CA3 region (B). Within the ventral hippocampus, stress history increased overall total volume in the DG and stress increased volume in the ventral apical CA1, which was again absent in stressed females with repeated LPS exposure (D). Bars represent mean ± SEM.