Figures & data
Figure 1. Male and female rats were exposed to a mixed-modality CAS paradigm according to the timeline (A). Female (B) and male (C) rats were weighed on isolation day (PND 35), the first (PND 38), fifth (PND 42), and tenth (PND 47) day of the stress paradigm. Both males and females gained weight through adolescence, but males exposed to CAS gained less weight than non-stress (NS) male controls (ANOVA, p < 0.05). CAS does not alter terminal weight in female or male adult rats exposed to CAS using a t-test (p > 0.05). Weight was measured for all animals in the morning on the day of collection. Data are presented as mean ± SEM. * indicates significance in Sidak’s multiple comparisons test comparing CAS to NS groups. α = 0.05. Data are presented as mean ± SEM.
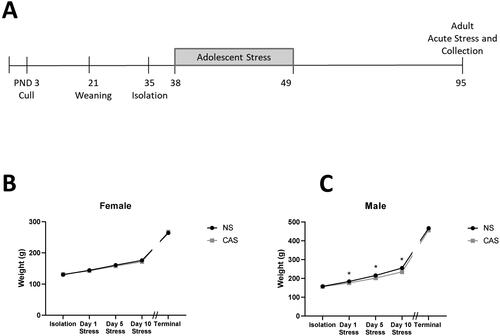
Figure 2. Trunk blood was collected immediately following rapid decapitation in female (A) and male (B) adult rats at baseline (BS; no acute stressor exposure) or 15, 30, or 120-minutes following a five-minute novel acute forced swim stressor challenge. Both males and females exhibited a main effect of time following acute stressor (p < 0.05), but CAS did not elicit a significant impact on plasma corticosterone. A Sidak’s multiple comparisons test showed that corticosterone at BS and 120 minutes following acute stressor exposure differed from 15 and 30 minutes, pooled across NS and CAS groups in both females (A) and males (B; p < 0.05, indicated by *). Data are presented as mean ± SEM.
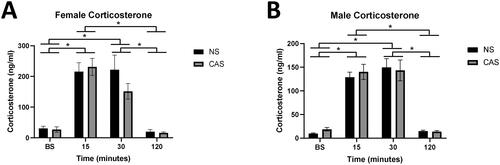
Figure 3. Male and female rats were exposed to CAS or non-stress (NS) control conditions and collected at baseline or 15, 30, or 120 minutes following exposure to an acute novel stressor in adulthood. Females exposed to CAS exhibited elevated Fkbp5 gene expression at baseline. There was no significant effect of CAS in males. Both females (A) and males (B) exhibited elevated expression of Fkbp5 with time following acute novel forced swim stressor challenge. Data are expressed as mean fold change (2-ΔΔCt) ± SEM normalized to same-sex NS baseline group. * indicates a significant difference in CAS to NS comparison with a priori t-test, p < 0.05. # indicates that gene expression at 120 minutes differs from baseline, 15, and 30 minutes, data pooled across NS and CAS groups with Sidak’s multiple comparisons test (p < 0.05).
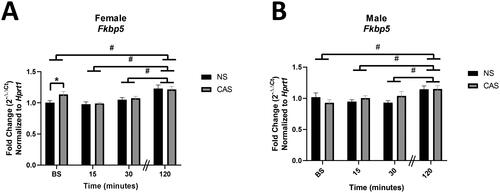
Figure 4. Female and male rats were exposed to CAS. In adulthood, tissue was collected at baseline (no acute stressor exposure) or 30 minutes following an acute stressor challenge (acute). A proximity ligation assay (PLA) was used to assess interactions between GR and FKBP5 protein. The corrected PLA ratio was calculated by dividing PLA counts in treated images by PLA counts in a negative technical control (single antibody, dorsal section). PLA signals in the dorsal CA1 in females (A) exhibit a significant interaction between adolescent stress and time after acute stress (p < 0.05). Adolescent or acute stress did not significantly impact PLA signal in the male dorsal CA1 (B), female ventral CA1 (C), or male ventral CA1 (D) (p > 0.05). * denotes significant effect in a post-hoc Tukey’s test. n = 6 per group. Data are presented as mean ± SEM.
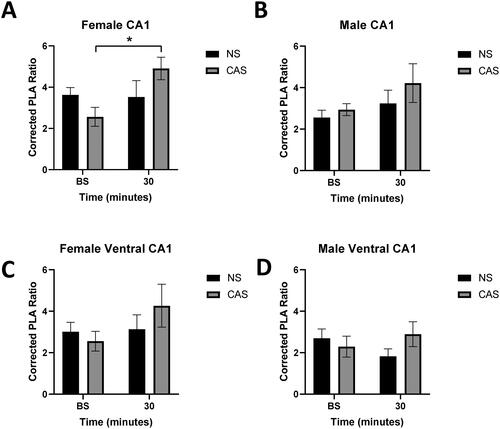
Figure 5. Male and female rats were exposed to CAS or non-stress (NS) control conditions and collected at baseline, 30, or 120 minutes following exposure to an acute novel stressor in adulthood. Data are expressed as mean fold change (2-ΔΔCt) ± SEM normalized to same-sex NS baseline group. # indicates a main effect of CAS. * indicates a significant difference between post-acute stress time points with Sidak’s multiple comparisons test. $ indicates a significant effect of a Sidak’s multiple comparisons test between groups.
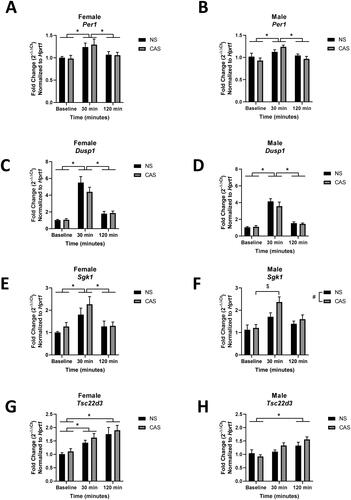
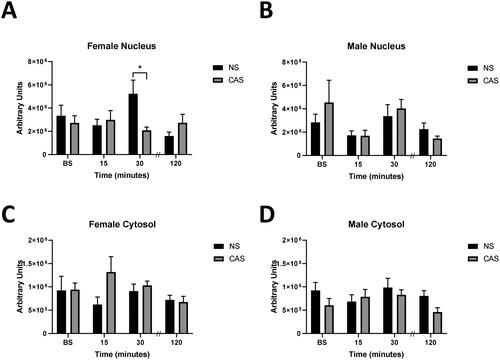
Figure 6. Female and male rats were exposed to CAS or non-stress (NS) control conditions. In adulthood, hippocampal tissue was collected at baseline (BS, no acute stressor exposure) and 15, 30, or 120-minutes following exposure to an acute novel stressor. Nuclear (A,B) and cytosolic (C,D) GR protein was assessed with western blot. Changes in GR antibody-tagged protein were impacted by CAS. There was a significant interaction between time following acute stressor exposure and history of CAS on nuclear GR antibody-tagged protein expression (A). Arbitrary densitometry units were normalized to H3 nuclear housekeeping protein or GAPDH cytosolic protein and a standard protein sample and expressed as mean ± SEM. * indicates significant effect in CAS to NS comparison with Sidak’s multiple comparisons test, p < 0.05. Data are presented as mean ± SEM. Note that following completion of this study, the antibody was discontinued by the company which limits interpretation of these data.