Figures & data
Figure 1. Effects of ARS on PWMT and TFL in mice. (A) The schedule of ARS and behavioral tests. Behavioral tests, including the PWMT and TFL were performed on day 0 after acclimation (baseline), and 2 hours after ARS on day 1. Nest-building behavioral test was performed on day 1 (16:00 p.m.) and measured on day 2 (09:00 a.m.). Mice were scheduled for MWMT and probe trial on days 2-7. Tissue samples were collected for western blotting on day 8. (B) Body weight (two-way ANOVA; Time: F1,7 = 3.5, P = 0.1036; Group: F1,7 = 3.15, P = 0.1192; Interaction: F1,7 = 1.75, P = 0.2275). (C) PWMT (two-way ANOVA; Time: F1,7 = 18.68, P < 0.01; Group: F1,7 = 0.0179, P = 0.8973; Interaction: F1,7 = 4.343, P = 0.0756). (D) TFL (two-way ANOVA; Time: F1,7 = 8.547, P < 0.05; Group: F1,7 = 4.706, P = 0.0667; Interaction: F1,7 = 7.29, P = 0.0306). Data are shown as mean ± SEM (n = 8). *P < 0.05, **P < 0.01. ARS: acute restraint stress; MWMT: Morris water maze test; N.S.: Not significant; PWMT: Paw withdrawal mechanical threshold; TFL: Tail-flick latency.
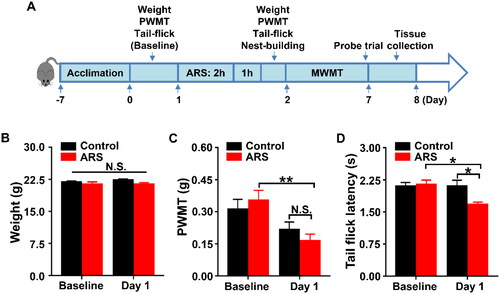
Figure 2. Comparisons of Nest-building score and MWMT between the Control and ARS groups. (A) Representative results of nest building behavior assay are shown. (B) Nest-building score (t-test, P > 0.05). (C) Representative trace graphs of Control and ARS mice in the MWMT. (D) Escape latency (two-way ANOVA; Time: F4,28 = 13.91, P < 0.001; Group: F1,7 = 1.328, P = 0.2870; Interaction: F4,28 = 0.8338, P = 0.5152). (E) Platform crossing (t-test, P > 0.05). Data are shown as mean ± SEM (n = 8). ARS: acute restraint stress; N.S.: Not significant.
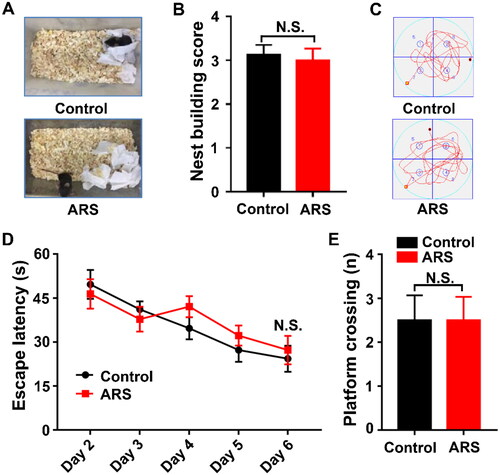
Figure 3. Levels of UPR and Keap1/Nrf2 pathway in hippocampus between control and ARS mice. (A) Representative immunoblot bands of GRP78, p-PERK, PERK, p-IRE1, IRE1, ATF6, Keap1 and Nrf2 expression in the hippocampus in control and ARS groups. (B-I) Western blot analysis of GRP78 (t = 0.2041, P = 0.8424), p-PERK/PERK ratio (t = 0.2476, P = 0.8095), PERK (t = 1.752, P = 0.1103), p-IRE1/IRE1 ratio (t = 0.03252, P = 0.9747), IRE1 (t = 0.2047, P = 0.8419), ATF6 (t = 0.2144, P = 0.8345), Keap1 (t = 0.1692, P = 0.8690), Nrf2 (t = 0.2491, P = 0.8083). Data are shown as mean ± SEM (n = 6).
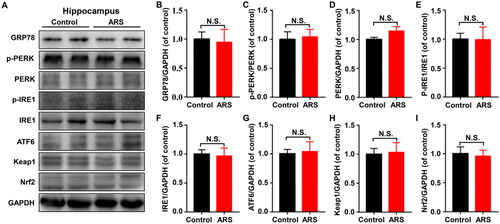
Figure 4. Effects of CRS on PWMT and TFL in mice. (A) The schedule of CRS and behavioral tests. Behavioral tests, including the PWMT and TFL were performed on day 0 after acclimation (baseline), and 24 hours after CRS on day 15. Nest-building behavioral test was performed on day 15 (16:00 p.m.) and measured on day 16 (09:00 a.m.). Mice were scheduled for MWMT and probe trial on days 16–21. Tissue samples were collected for western blotting on day 22. (B) Body weight (two-way ANOVA; Time: F2,16 = 1.636, P = 0.2257; Group: F1,8 = 0.07088, P = 0.7968; Interaction: F2,16 = 3.726, P = 0.0469). (C) PWMT (two-way ANOVA; Time: F1,8 = 34.73, P < 0.001; Group: F1,8 = 5.624, P < 0.05; Interaction: F1,8 = 30.65, P < 0.001). (D) TFL (two-way ANOVA; Time: F1,8 = 2.482, P = 0.1538; Group: F1,8 = 5.359, P < 0.05; Interaction: F1,8 = 7.343, P < 0.05). Data are shown as mean ± SEM (n = 9). *P < 0.05, ***P < 0.001.
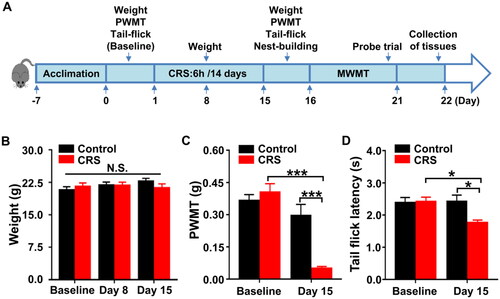
Figure 5. Comparisons of Nest-building score and MWMT between the Control and CRS groups. (A) Nest-building behavior assay. Representative results are shown. (B) Nest-building score (t-test, P < 0.05). (C) Representative trace graphs of Control and CRS mice in the MWMT. (D) Escape latency (two-way ANOVA; Time: F4,32 = 1.65, P = 0.1859; Group: F1,8 = 4.097, P = 0.0776; Interaction: F4,32 = 5.091, P < 0.01). (E) Platform crossing (t-test, P < 0.05). Data are shown as mean ± SEM (n = 9). *P < 0.05, **P < 0.01.
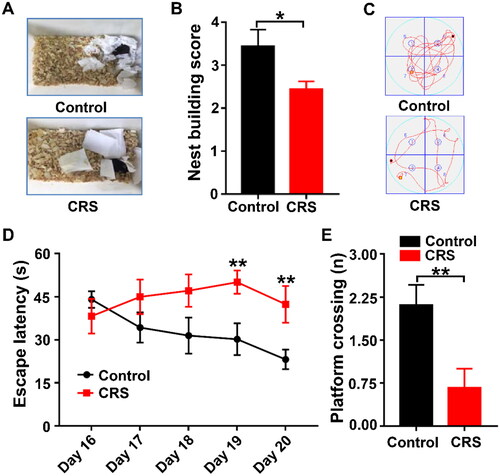
Figure 6. Levels of UPR and Keap1/Nrf2 pathway in spinal cord and hippocampus between control and CRS mice. (A) Representative immunoblot bands of GRP78, p-PERK, PERK, p-IRE1, IRE1, ATF6, Keap1, and Nrf2 expression in the spinal cord in control and CRS groups. (B-I) Western blot analysis of GRP78 (t = 1.616, P = 0.1372), p-PERK/PERK ratio (t = 0.595, P = 0.5651), PERK (t = 1.093, P = 0.3002), p-IRE1/IRE1 ratio (t = 1.014, P = 0.3343), IRE1 (t = 0.129, P = 0.8999), ATF6 (t = 0.2401, P = 0.8151), Keap1 (t = 6.201, P < 0.001), and Nrf2 (t = 3.446, P < 0.01) in the spinal cord. (J) Representative immunoblot bands of GRP78, p-PERK, PERK, p-IRE1, IRE1, ATF6, Keap1 and Nrf2 expression in the hippocampus in control and CRS groups. (K-S) Western blot analysis of GRP78 (t = 0.09809, P = 0.9238), p-PERK/PERK ratio (t = 0.0761, P = 0.9408), PERK (t = 0.1743, P = 0.8651), p-IRE1/IRE1 ratio (t = 0.3999, P = 0.6976), IRE1 (t = 0.4633, P = 0.6531), ATF6 (t = 0.08465, P = 0.9342), Keap1 (t = 2.252, P < 0.05), Nrf2 (t = 2856, P < 0.05) in the hippocampus. Data are shown as mean ± SEM (n = 6). *P < 0.05, **P < 0.01, ***P < 0.001.
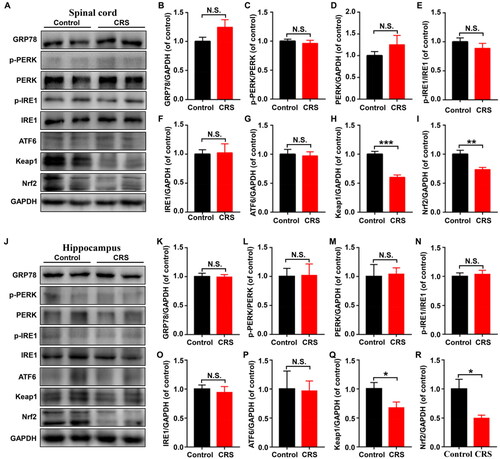
Figure 7. Correlation analysis between escape latency and pain sensitivity in ARS and CRS. (A) Correlation between escape latency and PWMT in ARS (r = −0.0006, P = 0.9981). (B) Correlation between escape latency and TFL in ARS (r = 0.2198, P = 0.4134). (C) Correlation between escape latency and PWMT in CRS (r = −0.4784, P = 0.0446). (D) Correlation between escape latency and TFL in CRS (r = −0.3591, P = 0.1433). PWMT: Paw withdrawal mechanical threshold.
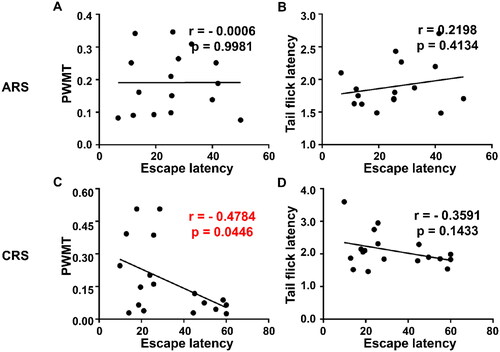
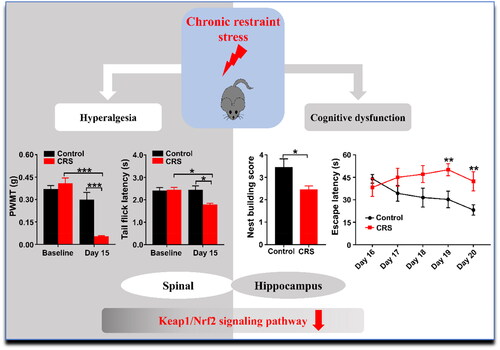
Figure 8. Schematic illustrating the mechanism by which Keap1/Nrf2 signaling pathway may contribute to chronic restraint stress-induced abnormal behaviors in pain sensitivity and cognitive function in mice.