
Figures & data
Figure 1. Experimental paradigm and representative sleep traces. (A) A visual depicting the experimental paradigm. Briefly, rodents were implanted with a telemeter one week prior to experimentation. Continuous recordings for core body temperature, EEG, and EMG were collected for 2 baseline days, five consecutive days of 30-min restraint stress, and 2 d of recovery. The light period is represented by open white boxes and the dark period is represented by dark boxes. (B) Representative EEG, EMG, and locomotor activity traces for 10 s epochs of Wake (denoted as W), SWS (denoted as S), and REM sleep (denoted as P, for paradoxical sleep).
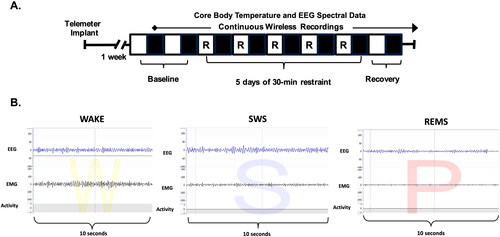
Figure 2. Core body temperature in male and female rats on Days 1 and 5 of restraint, displayed in both heat map and line graph format. A. Heat map of core body temperature in male rats on Days 1 and 5 of restraint. (B) Line graph illustrating core body temperature in male rats on Days 1 and 5 of restraint (with the 30-min restraint noted as the yellow rectangle). There was a main effect of Stress Day on the core body temperature of males between Days 1 and 5. Post hoc testing revealed that core body temperature during restraint was significantly lower on Day 5 compared to Day 1 of restraint in males. (C) Heat map of core body temperature in female rats on Days 1 and 5 of restraint. (D) Line graph illustrating core body temperature in female rats on Days 1 and 5 of restraint (with the 30-min restraint noted as the yellow rectangle). There was no main effect of Stress on core body temperatures in females. This suggests males habituated more fully to restraint stress by Day 5 than females.** indicates p < 0.01.
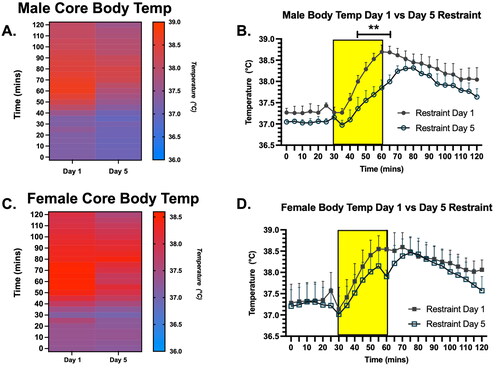
Figure 3. Percent power spectral density (PSD) for the Beta frequency during the last 15 min of restraint on Days 1 and 5 in male and female rats, displayed in both heat map and bar graph format. (A) Heat map of % power spectral density for the beta frequency in males and females during the last 15 min of restraint on Day 1. There was a significant effect of time (but not sex) on the % PSD of beta in males and females on Day 1. (B) Bar graph quantifying % power spectral density for the beta frequency from Panel A. (C) Heat map of % power spectral density for the beta frequency in males and females during the last 15 min of restraint on Day 5. There was no main effect of sex or time on % PSD of beta in males and females on Day 5 of restraint. (D) Bar graph quantifying % power spectral density for the beta frequency from Panel C.
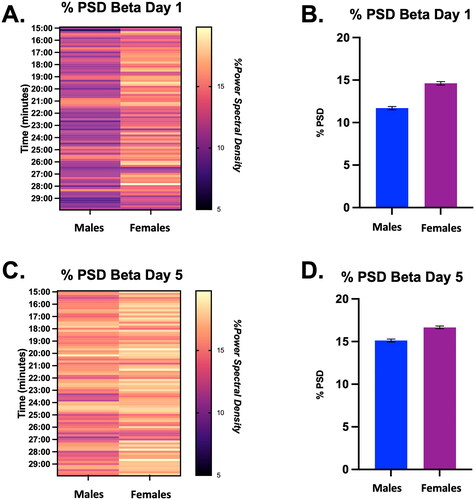
Figure 4. Percent power spectral density (PSD) for the alpha frequency during the last 15 min of restraint on Days 1 and 5 in male and female rats, displayed in both heat map and bar graph format. (A) Heatmap of the % power spectral density for the alpha frequency on Day 1 in males and females. There were no significant main effects of time or sex on the % power spectral density of alpha. (B) Bar graph quantifying % power pectral density for the alpha frequency from Panel A. (C) Heatmap of the % power spectral density for the alpha frequency on Day 5 in males and females. There were no significant main effects of time or sex on the % PSD of alpha. (D) Bar graph quantifying % power spectral density for the alpha frequency from Panel C.
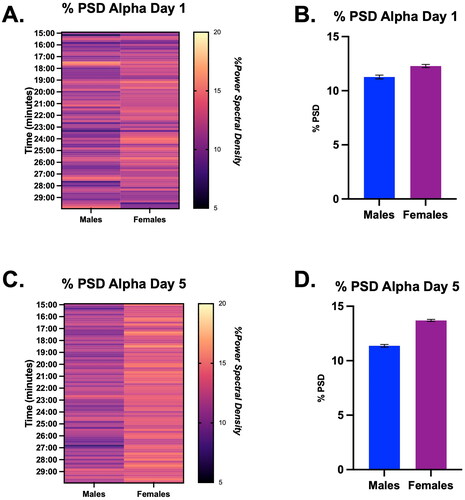
Figure 5. Percent power spectral density (PSD) for the delta frequency during a SWS to REMS transition on Days 1 and 5 in male and female rats, displayed in both heat map and bar graph format. (A) Heat map of % power spectral density for the delta frequency in males and females during a SWS to REMS transition on restraint Day 1. There was a significant main effect of sex on the % PSD of delta. (B) Bar graph quantifying % power spectral density for the delta frequency from Panel A. Females had a significantly lower % PSD of delta than males on Day 1 of restraint. (C) Heat map of % power spectral density for the delta frequency in males and females during a SWS to REMS transition on restraint Day 5. There was a significant main effect of sex on the % PSD of delta. (D) Bar graph quantifying % power spectral density for the delta frequency from Panel C. Females had a significantly higher % PSD of delta than males. This suggests that repeated restraint stress differentially affects the % PSD of delta in males and females; it may take females longer to initiate sleep recovery compared with males. * indicates p < 0.05.
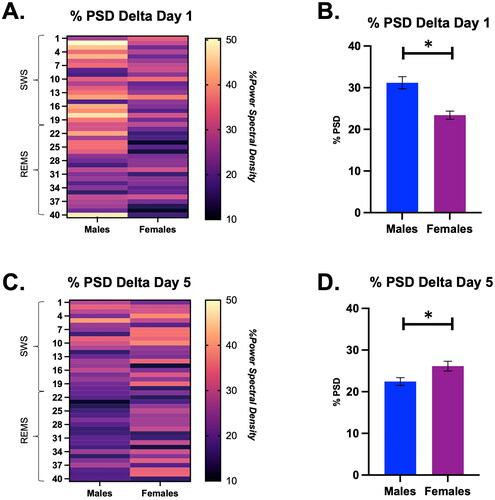
Figure 6. Percent power spectral density (PSD) for the Beta frequency during a SWS to REMS transition on Days 1 and 5 in male and female rats, displayed in both heat map and bar graph format. (A) Heat map of % power spectral density for the beta frequency in males and females during a SWS to REMS transition on Day 1 of restraint. There was a significant interaction of time and sex on the % PSD of beta. (B) Bar graph quantifying % power spectral density for the beta frequency from Panel A. Males demonstrate a higher % PSD of beta on Day 1 than females. (C) Heat map of % power spectral density for the beta frequency in males and females during a SWS to REMS transition on restraint Day 5. There was no main effect of time or sex on % PSD of beta in male and female rats on Day 5 of restraint. (D) Bar graph quantifying % power spectral density for the beta frequency from Panel C. Thus, males had a higher % PSD for beta than females during the SWS to REMS transition on Day 1 of restraint, but this was transient, as there were no sex differences by Day 5 of restraint. ** indicates p < 0.01.
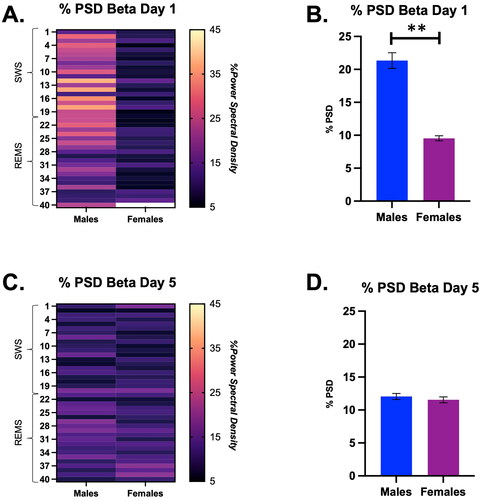
Figure 7. Percent power spectral density (PSD) for the alpha frequency during a SWS to REMS transition on Days 1 and 5 in male and female rats, displayed in both heat map and bar graph format. (A) Heat map of the % power spectral density for the alpha frequency in males and females during a SWS to REMS transition on restraint Day 1.There were no significant main effects of time or sex on restraint Day 1. (B) Bar graph quantifying % power spectral density for the alpha frequency from Panel A. (C) Heat map of the % power spectral density for the alpha frequency in males and females during a SWS to REMS transition on restraint Day 5. There was a significant main effect of sex on the % PSD of alpha. (D) Bar graph quantifying % power spectral density for the alpha frequency from Panel. Females appear to have a lower % PSD of alpha on Day 5 than males. These analyses suggest that by Day 5, repeated restraint stress may differentially affect the % PSD of alpha in males compared with females; this sex difference is not apparent until repeated stress exposure. ** indicates p < 0.01.
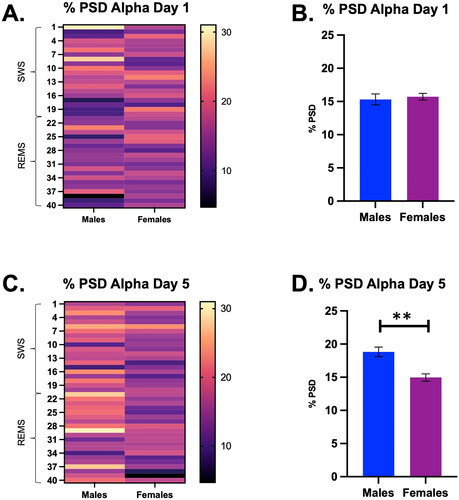
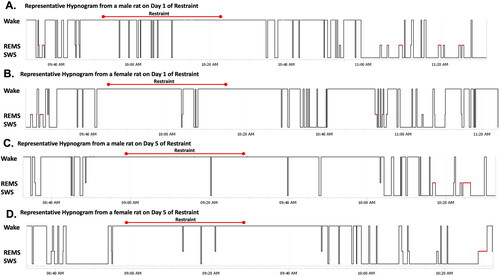
Figure 8. Representative hypnograms of male and female rats on Days 1 and 5 of restraint. Each hypnogram shows 120 min of sleep (SWS and REMS) and wake behavior before, during, and after 30 min of restraint. Restraint duration is denoted with a red bar above each hypnogram. (A) Hypnogram of male rat on Day 1 of restraint. (B) Hypnogram of female rat on Day 1 of restraint. (C) Hypnogram of male rat on Day 5 of restraint. (D) Hypnogram of female rat on Day 5 of restraint. After restraint on Day 1, more initial SWS recovery is apparent in the male rat compared with the female rat. In contrast, after restraint on Day 5, there is more prominent SWS recovery in the female rat compared with the male rat.
Availability of data and materials
Data can be made available upon request.