
Figures & data
Figure 1. Flow chart for recruitment, enrollment and retention of study participants.
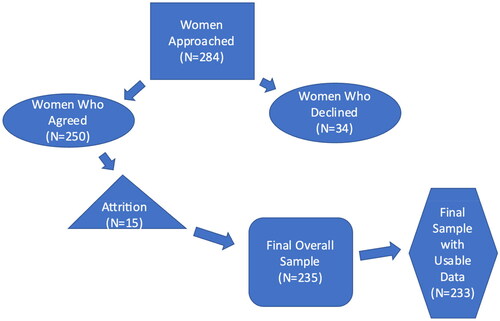
Table 1. Characteristics of women and infants.
Table 2. Percent of women who reported stressful events in various stressor domains.
Table 3. Mean (SE) infant HRV for low frequency (LF), high frequency (HF), and the LF/HF ratio for resting state, reactivity to the stressor, and the post-stressor period at 1, 6, and, 12 months postnatal.
Table 4. Multilevel regression for the association of prenatal stressors with low frequency (LF), high frequency (HF) and LF/HF ratio HRV during a baseline, resting state across the first year of lifeTable Footnote*.
Table 5. Multilevel regression for the association of prenatal stressors with low frequency (LF), high frequency (HF) and the LF/HF ratio HRV during a post-stressor period across the first year of lifeTable Footnote*.
Table 6. Multilevel regression for the association of prenatal stressors with HRV reactivity to a stressor for low frequency (LF), high frequency (HF) and the LF/HF ratio across the first year of lifeTable Footnote*.
Table 7. Linear regression for the association of prenatal stressors with low frequency heart rate variability at 1 month, 6 months and 12 months postnatalTable Footnote*.