Figures & data
Figure 1. Experimental procedure of Study 1. SECPT: Socially Evaluated Cold Pressor Test. Times are relative to start/termination of the SECPT/Warm water control.
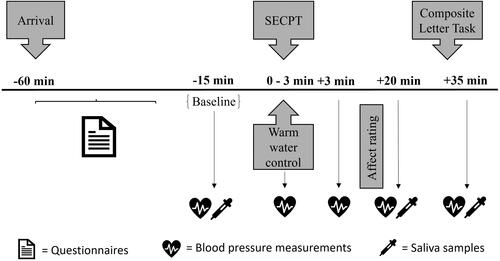
Figure 2. Mean cortisol concentrations (in nanomole per liter; A) and systolic/diastolic blood pressure levels (in millimeters of mercury; B) over the course of the testing session. SECPT: Socially Evaluated Cold Pressor Test; SBP: Systolic blood pressure; DBP: Diastolic Blood Pressure. Error bars represent standard errors of the mean. ***pBonf < 0.001 compared to non-stressed participants. Times are relative to termination of SECPT/Warm water control. Note: due to issues regarding calibration of the assay, cortisol values turned out unusually high.
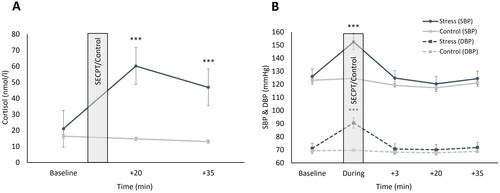
Figure 3. Mean reaction times (in milliseconds) per letter combination category and condition. *p < 0.05.
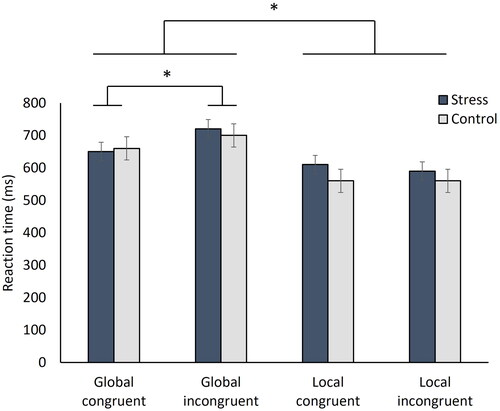
Figure 4. Experimental procedure of Study 2. (f-)TSST: (friendly-)Trier Social Stress Test; PANAS: Positive and Negative Affect Schedule; PASA: Primary Appraisal Secondary Appraisal. Times are relative to start/termination of the (f-)TSST.
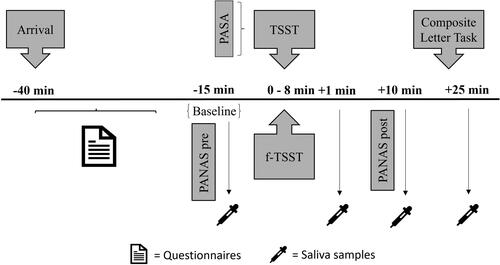
Figure 5. Mean cortisol concentrations (in nanomole per liter; A) and salivary alpha-amylase (sAA) levels (in units per milliliter; B) over the course of the testing session. (f-)TSST: (friendly-)Trier Social Stress Test. Error bars represent standard errors of the mean. ***p < 0.001/**p < 0.01/*p < 0.05 compared to non-stressed participants. Times are relative to termination of (f-)TSST.
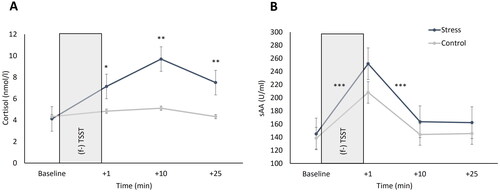
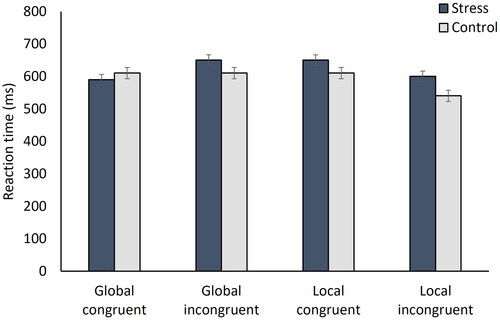
Figure 6. Mean reaction times (in milliseconds) per letter combination category and condition.