
Figures & data
Table 1. Descriptive statistics for and correlations between raw stress and inhibition variables.
Table 2. Models examining relations between response inhibition and early/recent life stress mismatch.
Table 3. Models examining relations between cognitive inhibition and early/recent life stress mismatch.
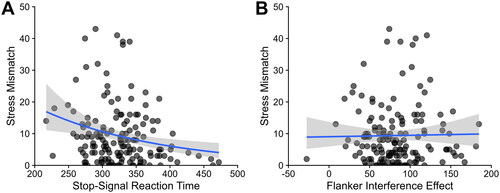
Figure 1. Stressor mismatch in relation to inhibitory control outcomes.
Note. A greater mismatch between early and recent life stress was associated with better response inhibition (i.e. less stop-signal reaction time, which indicates the time needed to stop an ongoing response) (a). However, mismatch between early and recent life stress was unassociated with cognitive inhibition (i.e. flanker interference) (b). Note that these figures omit two outliers in stress mismatch for ease of visualization; analyses excluding those outliers did not differ from those in the main text and are presented in Supplemental Material.
Supplemental Material
Download MS Word (117.6 KB)Data availability statement
Data and syntax for analyses are available at https://osf.io/qau6y/?view_only=384bd223ff5e494cb9e67e68b6a12670.