Figures & data
Figure 1. Experimental timeline. High fat diet or control diet was administered from 3 to 7 weeks of age. On the experimental day, stressor exposure (LPS injection or 15′ RST) occurred 1 h before brain collection/microglial isolation/RNA preparation.
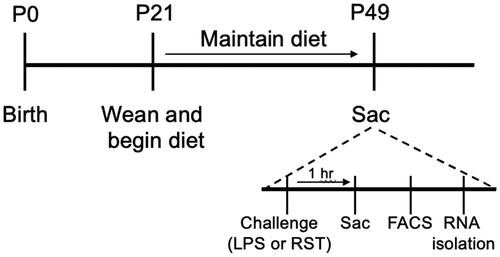
Figure 2. Venn diagrams showing ANOVA interactions (stress × diet) and main effects (stress or diet) in males and females. LPS treatment resulted in more stress × diet interactions in males vs. females, and more in LPS vs. restraint (only P2ry12). Main effects of stress or diet differed by sex, with main effects of stress or diet largely observed in males in response to restraint (LPS: lipopolysaccharide; RST: restraint). For main effects, arrows indicate up- or down-regulated genes.
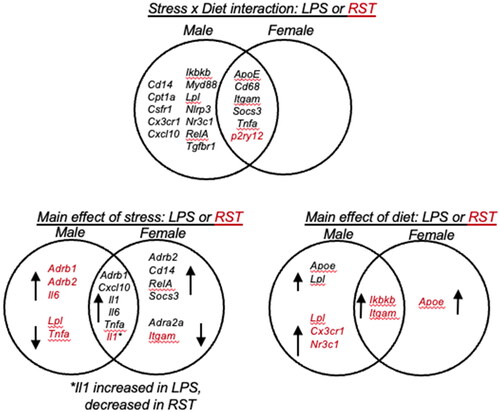
Figure 3. (A,B) Heatmap of gene expression changes in isolated microglia from LPS experiment (A, left) and restraint experiment (B, right). Genes are clustered by similarities in response patterns, with different colored bars to the right of the gene names indicating distinct clusters. The scale is log fold change. Cluster 1: genes increased by LPS and HFD in males only; cluster 2: HFD alone increases expression in males; cluster 3: HFD increases expression in both sexes; cluster 4: stress effect increases expression in LPS, decreases expression in RST across both sexes.
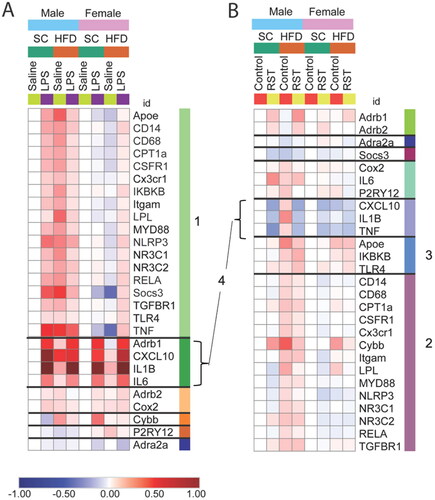
Figure 4. Diet and stressor (LPS) interact to affect Tnfa and Socs3 gene expression. (A,C) Tnfa (top) and Socs3 (bottom) gene expression in males was increased by HFD and LPS exposure separately, and HFD-fed males failed to increase gene expression in response to LPS. (B,D) In females, Tnfa and Socs3 gene expression decreased by HFD compared to controls, while HFD-fed females had an increase in gene expression, not seen in control-fed animals (HFD: high fat diet; LPS: lipopolysaccharide) (# interaction between diet and LPS, Graph legend = * main effect of stress; *p < 0.05, ***p < 0.001).
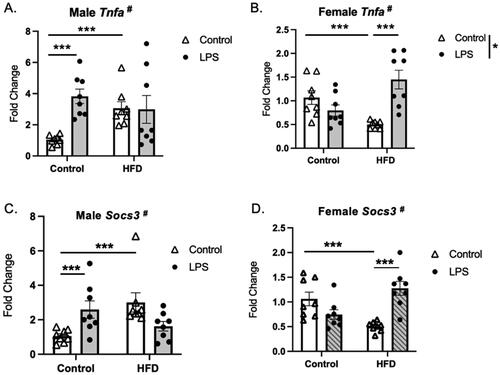
Table 1. Statistical results of gene expression analyses.
Figure 5. Main effect of HFD. Adolescent HFD exposure increased the expression of Igtam and Lpl in males (A,B) and Apoe was increased in males (C) and females (D) (HFD: high fat diet) *p < 0.05, **p < 0.01.
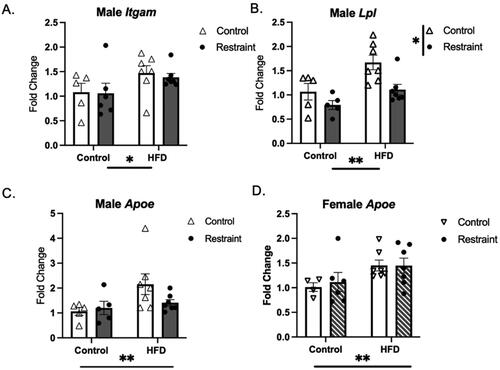
Figure 6. Gene expression of IL1β in response to stressor exposure. (A) Male and (B) female mice exposed to LPS show an increased expression Il1b. (C) Male and (D) female mice exposed to restraint stress show a significant decrease in Il1b expression. HFD did not affect the Il1b response to stress (HFD: high fat diet; LPS: lipopolysaccharide) (Graph legend = Control HFD * main effect of diet; *p < 0.05, **p < 0.01, ***p < 0.001).
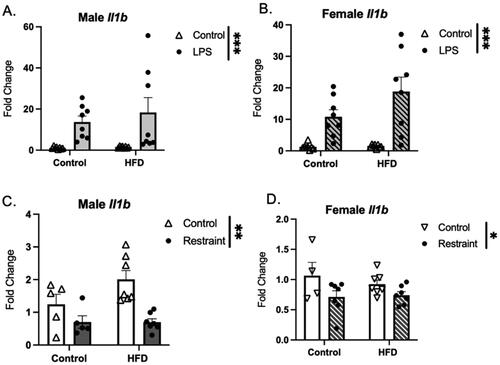
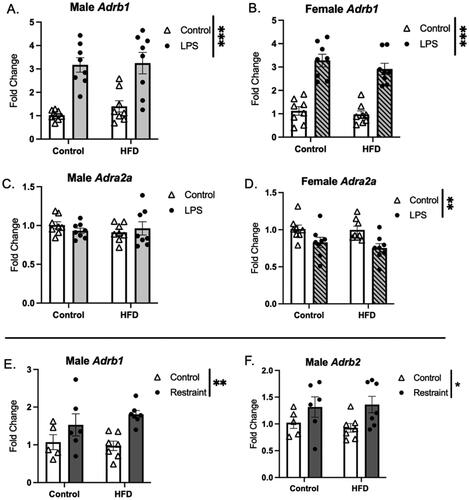
Figure 7. Stressor effects on adrenergic receptor expression. (A,B) Adrb1 expression was increased in response to LPS (A-males and B-females) and restraint (males only-E), and this response was not affected by HFD exposure. (C,D) Adra2a expression was decreased in females exposed to LPS (D), but not males. (F) Adrb2 was increased in males in response to RST (HFD: high fat diet; LPS: lipopolysaccharide; *p < 0.01, **p < 0.01, ***p < 0.001).