
Figures & data
Figure 1. Illustration of the experimental design. After 7 days of acclimation, the CUMS group began to undergo CUMS procedures, which lasted for 7 weeks in total. Once a week, fecal collection and disposal were performed on all mice starting from Day 14. The mice underwent behavioral tests in the following order: OFT on Day 50, SPT from Day 50 to Day 53, distal colorectal propulsion test on Day 54, TGIT on Day 54, and AWR on Day 55. Colon tissue samples were collected after the final behavioral test on Day 55. Note: OFT: open field test, SPT: sucrose preference test, TGIT: total gastrointestinal transit time, AWR: abdominal withdrawal reflex test, CUMS: Chronic unpredictable mild stress, H&E: hematoxylin and eosin.
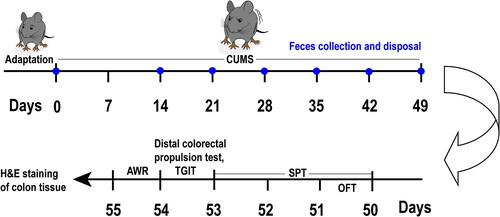
Table 1. Chronic unpredictable mild stress schedule
Figure 2. Mouse weight measurement. Two-way ANOVA, Bonferroni’s multiple comparisons test, n = 12–16 mice/group. Mean ± SD, F (7, 238) = 3.210, *P < 0.05.
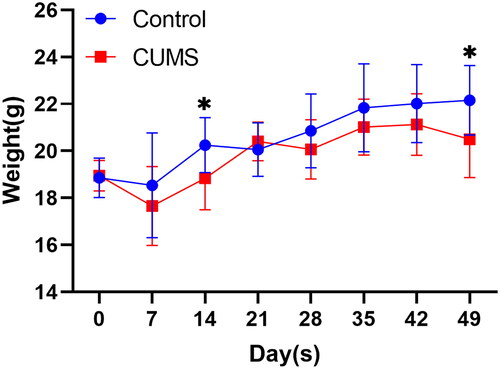
Figure 3. OFT and SPT. (A) track diagram of OFT; (B) peripheral access ratio of OFT; (C) preference of sucrose. T-tests, n = 6–10 mice/group. Mean ± SD, *P < 0.05, ***P < 0.001.
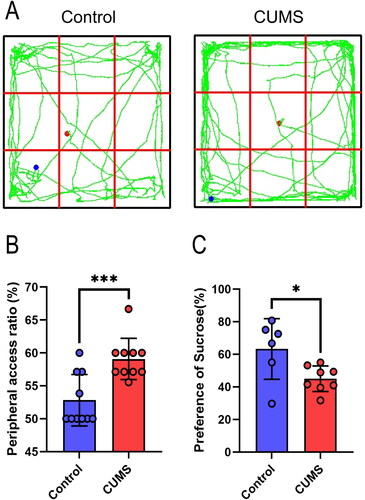
Figure 4. Analysis of defecation in mice during modeling. (A) fecal water content, F (6, 189) = 4.563; (B) fecal pellet output, F (6, 200) = 4.395; (C) fecal weight, F (6, 194) = 2.006. Two-way ANOVA, Bonferroni’s multiple comparisons test, n = 12–16 mice/group. Mean ± SD, *P < 0.05, ***P < 0.001.
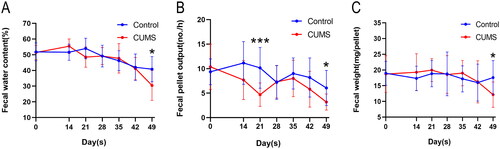
Figure 5. Dynamic detection of gastrointestinal tract. (A) Total transit time in the gastrointestinal tract; (B) Colonic propulsion time. Wilcoxon rank-sum test, n = 8–9 mice/group. Boxplots: lower, middle and upper hinges correspond to 25th, 50th and 75th percentiles. Upper and lower whiskers extend to largest and smallest value no further than 1.5 * IQR from respective hinge. *P < 0.05, **P < 0. 01. Note: GI: gastrointestinal.
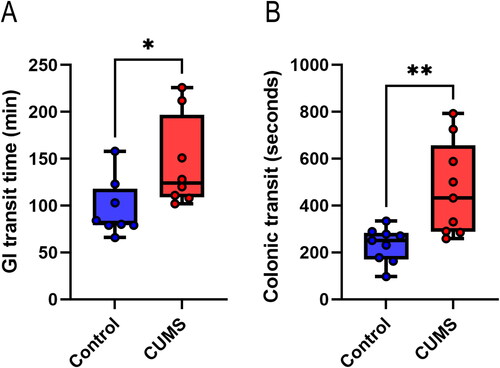
Figure 6. Abdominal withdrawal reflex scores at different levels of colorectal distension. Two-way ANOVA, Bonferroni’s multiple comparisons test, n = 6–7 mice/group. Mean ± SD, F (2, 22) = 1.515, **P < 0.01. Note: AWR: abdominal withdrawal reflex.
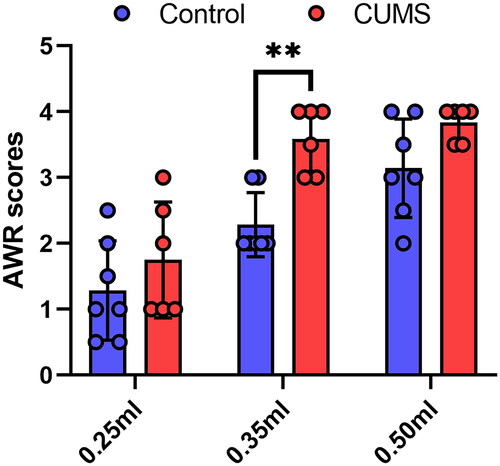
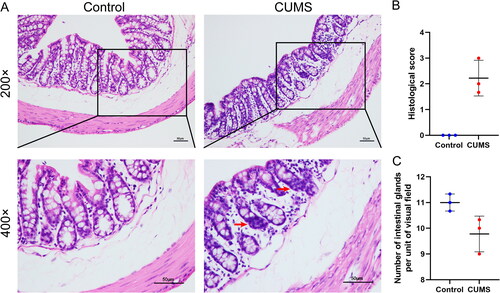
Figure 7. Histological examination of colon. (A) Representative hematoxylin and eosin-stained sections of distal colon (The red arrow represents abnormal inflammatory infiltration; scale bar = 50 μm); (B) Histological score; (C) Number of intestinal glands per unit of visual field (400×). Wilcoxon rank-sum test. Results are presented as mean ± SD, n = 3 mice/group.
Data availability statement
The dataset presented in this study can be obtained by contacting the authors.