
Figures & data
Figure 1. Consort diagram of subject recruitment, screening and randomization. Note the placebo treatment group was involved in a separate block of randomization; thus, it is not included here.
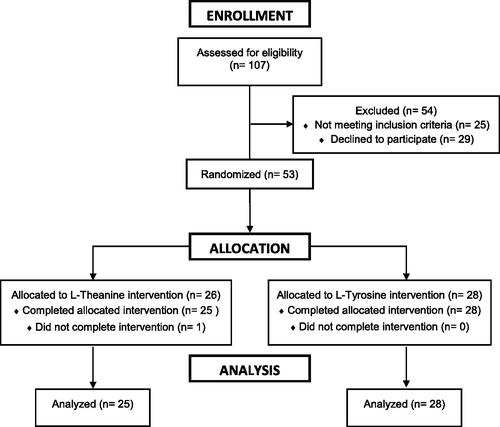
Figure 2. Overview of experimental procedures. Note, the figure was adopted from our past work (McAllister et al., Citation2024).
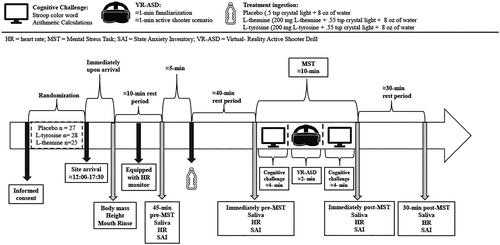
Table 1. Subject descriptive characteristics
Figure 3. Changes in salivary α-amylase (sAA) concentrations across time and between treatments. -45 = 45 min pre MSC, pre = immediately pre MSC, post: immediately post MSC, +30 = 30 min post MSC. θ Indicates higher sAA concentrations in L-tyrosine compared to both L-theanine (p < 0.001) and placebo (p < 0.001), and higher sAA concentrations in the L-theanine group compared to placebo (p < 0.001). *Indicates significantly higher sAA concentrations compared to pre and 30 min post MSC (p < 0.001).
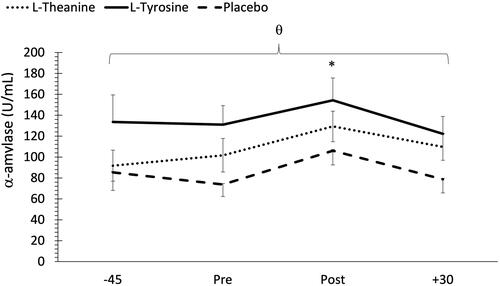
Figure 4. Changes in secretory immunoglobuin A (SIgA) concentrations across time and between treatments. -45 = 45 min pre MSC, pre: immediately pre MSC, post: immediately post MSC, +30 = 30 min post MSC. θ Indicates significantly lower SIgA concentrations in the L-tyrosine group compared to placebo (p < 0.001). *Indicates a significant increase in SIgA post MSC compared to all other timepoints (p < 0.001).
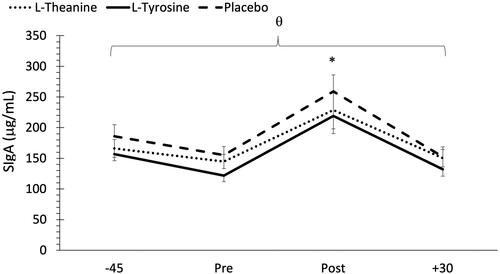
Figure 5. a: Changes in heart rate (HR) across time and between treatments. θ Indicates significantly higher HR in the L-theanine group compared to the placebo (p < 0.001) and L-tyrosine (p = 0.03) groups. *Indicates a significantly higher HR post MSC compared to all other timepoints (p < 0.05). : Changes in state anxiety inventory (SAI) across time and between treatments. θ Indicates SAI values were significantly different in all treatment groups, with the lowest levels in the placebo treatment, and the highest levels in the L-tyrosine treatment. *Indicates a significant increase in mean SAI values post MSC compared to all other timepoints (p < 0.05).
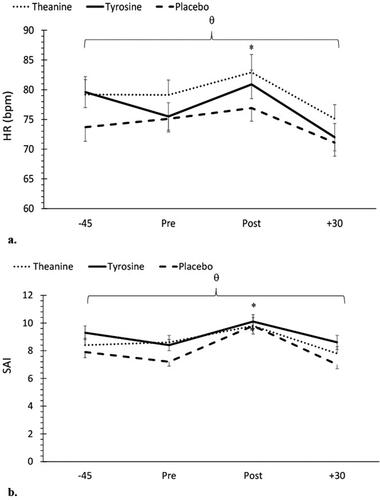
Table 2. Mental challenge data (Stroop plus mental arithmetic challenge) for L-theanine, L-tyrosine and placebo groups presented in mean values ± standard deviation, respectively.