Figures & data
Table I. Characteristics of sham-operated and infarcted SD rats.
Table II. infarct Size And Resting Values Of Mabp And Heart Rate In Sham-operated And Infarcted Rats Before Intracerebroventricular Infusion Of Acsf, Vp Or—{d(ch2)5[tyr(me)2ala-]vp} (V1ant).
Figure 1 (A) Comparison of changes in MABP from baseline in the sham-operated and the infarcted (MI) rats during i.c.v infusions of VP V1 receptor antagonist (V1ANT), *—significant differences between the corresponding means in the rats with and without the infarct, #—significant difference from baseline. (B) Changes in resting MABP from baseline during i.c.v. infusion of aCSF, arginine VP and VP V1ANT in the sham-operated (upper part) and the infarcted (MI, lower part) rats. Number of rats in the groups: sham CSF—9, sham VP—8, sham V1ANT—8, infarct CSF—8, infarct VP—8, infarct V1ANT—8. Means ± standard errors are shown. The symbols indicate significant differences between the corresponding means in different groups of experiments:+ − significant difference between aCSF and VP groups, #—significant difference between aCSF and V1ANT groups, *—significant difference between VP and V1ANT groups. The results were considered significant if P < 0.05.
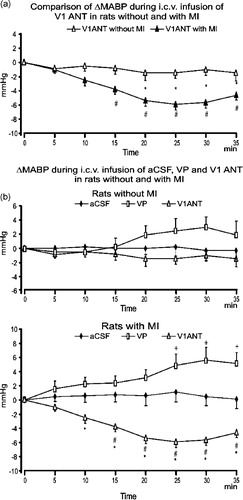
Figure 2 Representative tracings of air jet stress-induced MABP and heart rate changes in the sham-operated (left) and the infarcted (MI, right) rats. The rectangle indicates the time of air jet stress application.
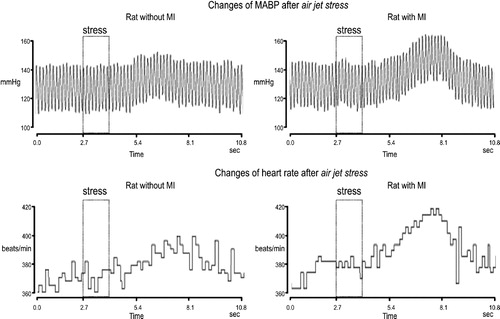
Figure 3 Maximum changes in mean arterial pressure (ΔMABPmax) and heart rate in response to the air jet stress in rats with and without the MI subjected to i.c.v. infusions of aCSF, arginine VP or VP V1ANT. Number of rats in the groups: sham CSF—9, sham VP—8, sham V1ANT—8, infarct CSF—8, infarct VP—8, infarct V1ANT—8. Means ± standard errors are shown. *—significant difference from baseline, #—significant difference between the corresponding groups. The results were considered significant if P < 0.05.
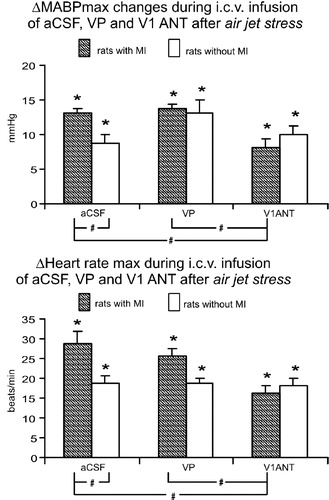
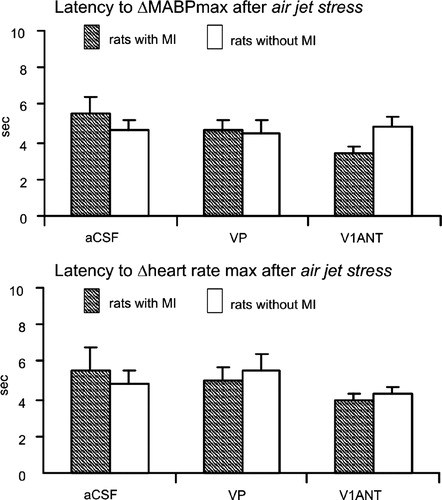
Figure 4 The time zero-peak latency between application of air jet stress and MABP and heart rate during i.c.v. infusions of cerebrospinal fluid (aCSF), VP and VP V1ANT. Number of rats in the group: sham CSF—9, sham VP—8, sham V1ANT—8, infarct CSF—8, infarct VP—8, infarct V1ANT—8.