Publication Cover
Stress
The International Journal on the Biology of Stress
Volume 9, 2006 - Issue 3
519
Views
23
CrossRef citations to date
0
Altmetric
Original

Effects of daily and acute restraint stress during lactation on maternal aggression and behavior in mice

&
Pages 171-180 | Received 02 May 2006, Accepted 22 Aug 2006, Published online: 07 Jul 2009

Figures & data

Figure 1 Overview of the timeline for behavioral observations (A) and restraint stress application for the daily and acute stress groups (B). See Methods for additional details. Daily stress ended 2 h prior to maternal behavior observations and 165 min prior to aggression testing. Acute stress ended just prior to aggression testing.
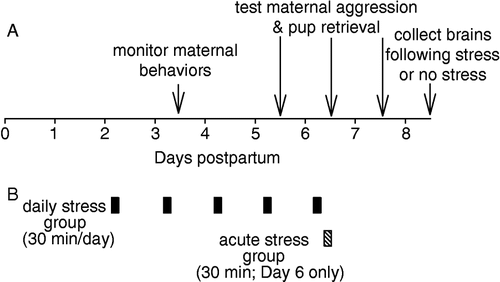
Figure 1 Overview of the timeline for behavioral observations (A) and restraint stress application for the daily and acute stress groups (B). See Methods for additional details. Daily stress ended 2 h prior to maternal behavior observations and 165 min prior to aggression testing. Acute stress ended just prior to aggression testing.

Figure 2 Analysis of maternal behaviors in controls and mice exposed to daily restraint stress. On Day 3, no differences between groups were found in terms of proportion of time spent either (A) high arched-back nursing; (B) licking and grooming of pups; (C) self grooming; or (D) nest building. Bars represent means ± SE. White bars indicate control mice (n = 19) and black bars indicate mice stressed daily (n = 10).
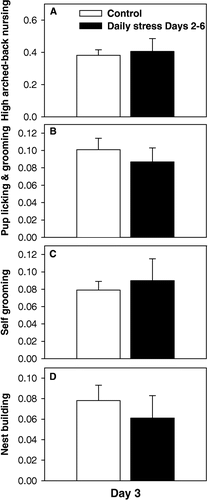
Figure 2 Analysis of maternal behaviors in controls and mice exposed to daily restraint stress. On Day 3, no differences between groups were found in terms of proportion of time spent either (A) high arched-back nursing; (B) licking and grooming of pups; (C) self grooming; or (D) nest building. Bars represent means ± SE. White bars indicate control mice (n = 19) and black bars indicate mice stressed daily (n = 10).

Figure 3 Analysis of maternal aggression and pup retrieval in controls and mice exposed to daily restraint stress. On neither Days 5, 6, or 7, were any differences between groups found for either (A) time aggressive; (B) number of attacks; (C) time to first attack; or (D) time to retrieve first pup. Bars represent means ± SE. White bars indicate control mice (n = 10) and black bars indicate daily stress mice (n = 10).
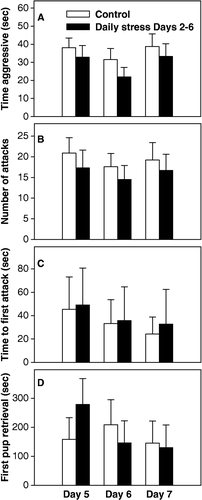
Figure 3 Analysis of maternal aggression and pup retrieval in controls and mice exposed to daily restraint stress. On neither Days 5, 6, or 7, were any differences between groups found for either (A) time aggressive; (B) number of attacks; (C) time to first attack; or (D) time to retrieve first pup. Bars represent means ± SE. White bars indicate control mice (n = 10) and black bars indicate daily stress mice (n = 10).

Figure 4 Analysis of maternal aggression in control and acutely stressed (stress only on Day 6) mice. On Day 5 (prior to stress application), no differences existed between groups in any aggression measure. On Day 6, significant decreases in aggression were found in acutely stressed mice in terms of (A) time aggressive, (B) number of attacks, but not in time to first attack (p = 0.09) (C). On Day 7 (one day after acute stress on Day 6), no differences in aggression existed between groups. Time to retrieve first pup remained similar between groups on all test days. Bars represent means ± SE. White bars indicate control mice (n = 10) and black bars indicate acute stress on Day 6 mice (n = 9). **, p < 0.01; ***, p < 0.001; one-way ANOVA.
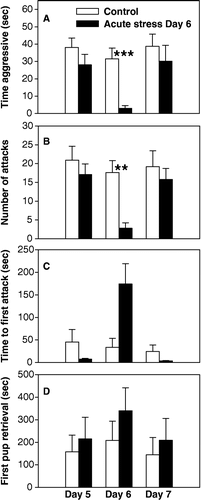
Figure 4 Analysis of maternal aggression in control and acutely stressed (stress only on Day 6) mice. On Day 5 (prior to stress application), no differences existed between groups in any aggression measure. On Day 6, significant decreases in aggression were found in acutely stressed mice in terms of (A) time aggressive, (B) number of attacks, but not in time to first attack (p = 0.09) (C). On Day 7 (one day after acute stress on Day 6), no differences in aggression existed between groups. Time to retrieve first pup remained similar between groups on all test days. Bars represent means ± SE. White bars indicate control mice (n = 10) and black bars indicate acute stress on Day 6 mice (n = 9). **, p < 0.01; ***, p < 0.001; one-way ANOVA.

Table I.  Mean±SE c-Fos expression for two groups (control and daily stress) 100 min following either no restraint (control) or acute restraint (acute) on Day 8. P-values reflect overall effect of restraint stress (using a two-way ANOVA; see Methods for details) on c-Fos and only brain regions with p-values less than 0.07 are shown. Level of significance as determined by QVALUE was 0.039 (see Methods for details). Bold indicates a significant effect of restraint stress on c-Fos (p<0.05) within a given group using a one-way ANOVA.

Reprints and Corporate Permissions

Please note: Selecting permissions does not provide access to the full text of the article, please see our help page How do I view content?

To request a reprint or corporate permissions for this article, please click on the relevant link below:

Academic Permissions

Please note: Selecting permissions does not provide access to the full text of the article, please see our help page How do I view content?

Obtain permissions instantly via Rightslink by clicking on the button below:

If you are unable to obtain permissions via Rightslink, please complete and submit this Permissions form. For more information, please visit our Permissions help page.