Publication Cover
Stress
The International Journal on the Biology of Stress
Volume 10, 2007 - Issue 1
427
Views
20
CrossRef citations to date
0
Altmetric
Original

AMPK alpha subunit gene characterization in Artemia and expression during development and in response to stress

, , , &
Pages 53-63 | Received 19 Jul 2006, Accepted 14 Nov 2006, Published online: 07 Jul 2009

Figures & data

Figure 1 Schematic diagram of Afr-AMPKalpha1 (A) and Afr-AMPKalpha2 (B) cDNAs showing locations of primers for PCR and strategy of the gene cloning. Arrowheads represent primers and lines under them indicate cDNA fragments amplified with the primers by PCR, 5′- and 3′-RACE. The dashed lines indicate the 244-bp deletion in cDNA sequence of Afr-AMPKalpha2 compared with that of Afr-AMPKalpha1.
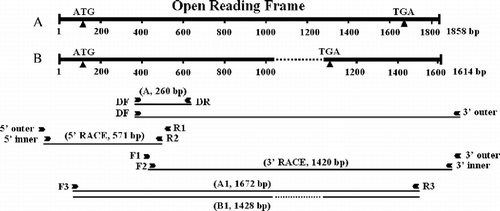
Figure 1 Schematic diagram of Afr-AMPKalpha1 (A) and Afr-AMPKalpha2 (B) cDNAs showing locations of primers for PCR and strategy of the gene cloning. Arrowheads represent primers and lines under them indicate cDNA fragments amplified with the primers by PCR, 5′- and 3′-RACE. The dashed lines indicate the 244-bp deletion in cDNA sequence of Afr-AMPKalpha2 compared with that of Afr-AMPKalpha1.

Table I.  Nucleotide sequences and positions of primers used in PCR.

Figure 2 Nucleotide sequences and deduced amino acid sequences of Afr-AMPKalpha1 and Afr-AMPKalpha2 cDNAs. The basic serine/threonine protein kinase domain is boxed. The amino acid sequence found in both Afr-AMPKalpha1 and Afr-AMPKalpha2 is shown in bold and italics. The amino acid sequence only in Afr-AMPKalpha2 is shaded. The 244-bp deletion of Afr-AMPKalpha2 compared with Afr-AMPKalpha1 is shown in lower case as a dashed line. The start and stop codons are underlined. The stop codon for Afr-AMPKalpha2 is italicized while that of Afr-AMPKalpha1 is shaded. Two putative polyadenylation signals AATTAA and ATTAAA are underlined and boxed, respectively.
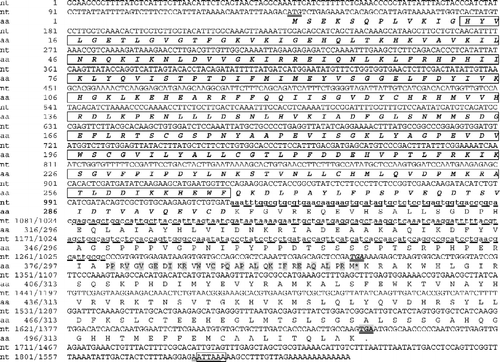
Figure 2 Nucleotide sequences and deduced amino acid sequences of Afr-AMPKalpha1 and Afr-AMPKalpha2 cDNAs. The basic serine/threonine protein kinase domain is boxed. The amino acid sequence found in both Afr-AMPKalpha1 and Afr-AMPKalpha2 is shown in bold and italics. The amino acid sequence only in Afr-AMPKalpha2 is shaded. The 244-bp deletion of Afr-AMPKalpha2 compared with Afr-AMPKalpha1 is shown in lower case as a dashed line. The start and stop codons are underlined. The stop codon for Afr-AMPKalpha2 is italicized while that of Afr-AMPKalpha1 is shaded. Two putative polyadenylation signals AATTAA and ATTAAA are underlined and boxed, respectively.

Figure 3 Expression of AMPK alpha subunit gene in Artemia and cysts at various developmental stages. (A) Northern blot analysis of Artemia AMPK alpha subunit gene expression in developing cysts incubated for 0, 4, 8 and 12 h, and in developing Artemia (nauplii, 2, 5 and 10 mm). (B) Semi-quantitative RT-PCR analysis of Afr-AMPKalpha1 expression in IC, dry activated cysts (DAC), hydrated activated cysts that were incubated for 0–14 h, and in nauplii. (C) Semi-quantitative RT-PCR analysis of Afr-AMPKalpha1 expression in developing Artemia (nauplii, 2–10 mm), in adult males and females (FWSG, females with two oocyte-filled lateral pouches and white shell gland; FBSG, females with two oocyte-filled lateral pouches and brown shell gland; FDE, females with diapause-destined embryos; FNE, females with non-diapause embryos). (D) Semi-quantitative RT-PCR analysis of Afr-AMPKalpha1 expression in the head and thoracic region of Artemia with diapause-destined embryos (HFDE), and with non-diapause embryos (HFNE). Asterisks (**) indicate significant differences (P < 0.01, by one-way ANOVA).
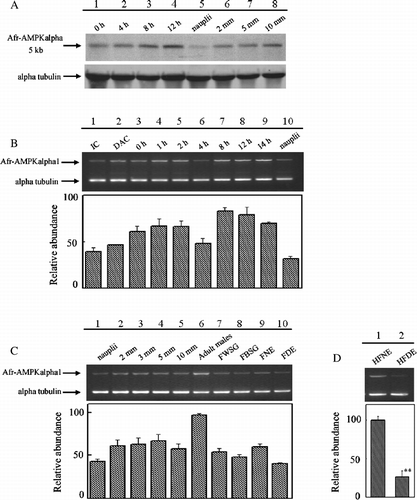
Figure 3 Expression of AMPK alpha subunit gene in Artemia and cysts at various developmental stages. (A) Northern blot analysis of Artemia AMPK alpha subunit gene expression in developing cysts incubated for 0, 4, 8 and 12 h, and in developing Artemia (nauplii, 2, 5 and 10 mm). (B) Semi-quantitative RT-PCR analysis of Afr-AMPKalpha1 expression in IC, dry activated cysts (DAC), hydrated activated cysts that were incubated for 0–14 h, and in nauplii. (C) Semi-quantitative RT-PCR analysis of Afr-AMPKalpha1 expression in developing Artemia (nauplii, 2–10 mm), in adult males and females (FWSG, females with two oocyte-filled lateral pouches and white shell gland; FBSG, females with two oocyte-filled lateral pouches and brown shell gland; FDE, females with diapause-destined embryos; FNE, females with non-diapause embryos). (D) Semi-quantitative RT-PCR analysis of Afr-AMPKalpha1 expression in the head and thoracic region of Artemia with diapause-destined embryos (HFDE), and with non-diapause embryos (HFNE). Asterisks (**) indicate significant differences (P < 0.01, by one-way ANOVA).

Figure 4 Expression of Artemia alpha subunit gene in Artemia and cysts in response to stresses. (A) Northern blot analysis of AMPK alpha subunit gene in response to varied stresses. Lane 1, RNAs from Artemia in normal conditions; Lanes 2 and 3, RNAs from starved adults for 2 or 9 days (ST2 and ST9); Lanes 4–6, RNAs from heat-shocked adults; Lanes 7 and 8, RNAs from heat shocked cysts; Lanes 9–11, RNAs from hyperosmotically shocked adults (HO 15, HO 30 and HO 60). (B) Semi-quantitative RT-PCR analysis of Afr-AMPkalpha1 expression in adults in response to heat-shock stress, hyperosmotic stress and starvation stress. (C) Semi-quantitative RT-PCR analysis of Afr-AMPKalpha1 expression in cysts subjected to heat-shock stress. (D) Semi-quantitative RT-PCR analysis of Afr-AMPKalpha1 expression in starved adults. Asterisks (**) indicate significant differences (P < 0.01, by one-way ANOVA versus control).
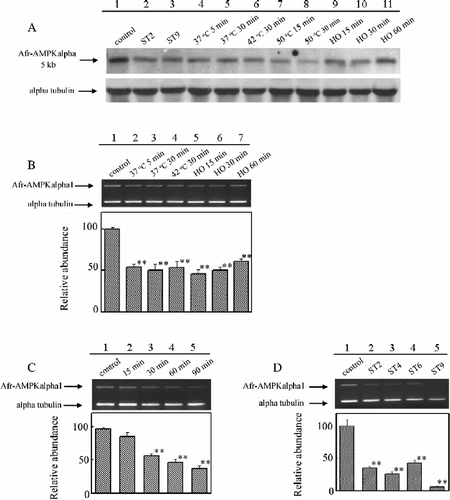
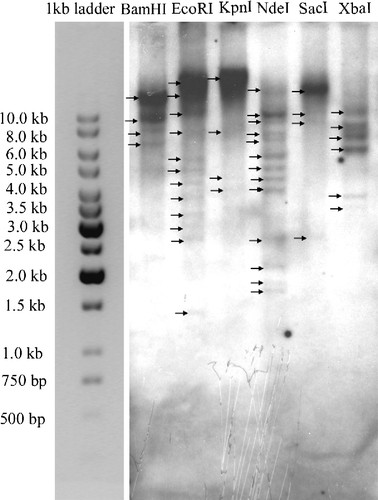
Figure 4 Expression of Artemia alpha subunit gene in Artemia and cysts in response to stresses. (A) Northern blot analysis of AMPK alpha subunit gene in response to varied stresses. Lane 1, RNAs from Artemia in normal conditions; Lanes 2 and 3, RNAs from starved adults for 2 or 9 days (ST2 and ST9); Lanes 4–6, RNAs from heat-shocked adults; Lanes 7 and 8, RNAs from heat shocked cysts; Lanes 9–11, RNAs from hyperosmotically shocked adults (HO 15, HO 30 and HO 60). (B) Semi-quantitative RT-PCR analysis of Afr-AMPkalpha1 expression in adults in response to heat-shock stress, hyperosmotic stress and starvation stress. (C) Semi-quantitative RT-PCR analysis of Afr-AMPKalpha1 expression in cysts subjected to heat-shock stress. (D) Semi-quantitative RT-PCR analysis of Afr-AMPKalpha1 expression in starved adults. Asterisks (**) indicate significant differences (P < 0.01, by one-way ANOVA versus control).

Figure 5 Southern blot analysis of total genomic DNA (10 μg per lane). Genomic DNA sample was digested with BamHI, EcoRI, KpnI, NdeI, SacI and XbaI, followed by hybridization with DIG-labeled probe A1.

Figure 5 Southern blot analysis of total genomic DNA (10 μg per lane). Genomic DNA sample was digested with BamHI, EcoRI, KpnI, NdeI, SacI and XbaI, followed by hybridization with DIG-labeled probe A1.

Reprints and Corporate Permissions

Please note: Selecting permissions does not provide access to the full text of the article, please see our help page How do I view content?

To request a reprint or corporate permissions for this article, please click on the relevant link below:

Academic Permissions

Please note: Selecting permissions does not provide access to the full text of the article, please see our help page How do I view content?

Obtain permissions instantly via Rightslink by clicking on the button below:

If you are unable to obtain permissions via Rightslink, please complete and submit this Permissions form. For more information, please visit our Permissions help page.