Publication Cover
Stress
The International Journal on the Biology of Stress
Volume 10, 2007 - Issue 2
279
Views
11
CrossRef citations to date
0
Altmetric
Original

Differing effects of acute and chronic stressors on plasma osteocalcin and leptin in rats

, , , , , , & show all
Pages 163-172 | Received 27 Nov 2006, Accepted 04 Mar 2007, Published online: 07 Jul 2009

Figures & data

Figure 1 Plasma osteocalcin (left panel) and leptin (right panel) concentrations (mean ± SEM) in rats subjected to acute foot restraint Imo. Rats were provided unlimited access to a control liquid diet (Ad lib), a similar isocaloric diet containing 5% ethanol w/v (ethanol), or were restricted to the average amount of isocaloric liquid diet consumed by ethanol rats on the previous day (pair-fed). Each rat was implanted with a cannula in the tail artery to allow blood sampling without handling or otherwise disturbing the animal. Following collection of baseline samples, rats were subjected to Imo for 2 h, during which additional blood samples were collected. Numbers in parentheses indicate number of animals sampled for each measure. There were no differences in basal levels of either parameter. Within each treatment, (b) indicates significant difference from mean basal level for that group, p < 0.05. (e) and (p) indicate significant difference from ethanol or pair-fed at the time point measured, p < 0.05.
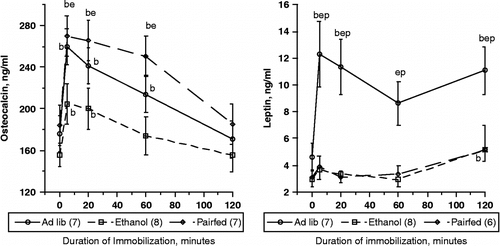
Figure 1 Plasma osteocalcin (left panel) and leptin (right panel) concentrations (mean ± SEM) in rats subjected to acute foot restraint Imo. Rats were provided unlimited access to a control liquid diet (Ad lib), a similar isocaloric diet containing 5% ethanol w/v (ethanol), or were restricted to the average amount of isocaloric liquid diet consumed by ethanol rats on the previous day (pair-fed). Each rat was implanted with a cannula in the tail artery to allow blood sampling without handling or otherwise disturbing the animal. Following collection of baseline samples, rats were subjected to Imo for 2 h, during which additional blood samples were collected. Numbers in parentheses indicate number of animals sampled for each measure. There were no differences in basal levels of either parameter. Within each treatment, (b) indicates significant difference from mean basal level for that group, p < 0.05. (e) and (p) indicate significant difference from ethanol or pair-fed at the time point measured, p < 0.05.

Figure 2 Effect of 10 min restraint in wire mesh cylinders on plasma corticosterone and osteocalcin concentrations (mean ± SEM). Panels A and C show values from blood samples taken from tail cuts before and after 10 min restraint 8 weeks prior to formation of triad social housing. Following initial restraint testing, the dominance ranking was determined by observation of behaviors during 30 min interaction. After 8 weeks, singly housed control rats were transferred to single cages and placed in a separate room. Triad-housed rats were placed in cages as described and allowed to interact directly for 1 h per day, but were separated by dividers that allowed sensory but not physical contact for the remaining 23 h. Panels B and D are from blood samples taken 7 weeks after initiation of triad housing, 15 weeks after initial restraint test. Significant differences between pre- (dark shaded bars) and post-restraint (light shaded bars) samples within housing and social rank status are indicated by *p < 0.05; **p < 0.01; ***p < 0.001. Values are shown relative to established social rank in triads, indicated by “Dom”, socially dominant rats, “Subdom” subdominant rats, “Subord”, subordinant rats, or “Single”, singly housed rats. The percent increase in corticosterone induced by restraint of long-term triad housed rats, indicated by numbers in post-restraint bars, was significantly greater (p < 0.01) than in rats tested 8 weeks prior to triad formation. The percent increase in osteocalcin induced by restraint did not differ between tests and is not shown.
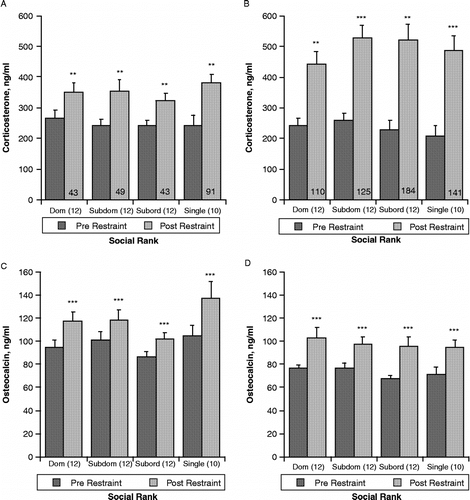
Figure 2 Effect of 10 min restraint in wire mesh cylinders on plasma corticosterone and osteocalcin concentrations (mean ± SEM). Panels A and C show values from blood samples taken from tail cuts before and after 10 min restraint 8 weeks prior to formation of triad social housing. Following initial restraint testing, the dominance ranking was determined by observation of behaviors during 30 min interaction. After 8 weeks, singly housed control rats were transferred to single cages and placed in a separate room. Triad-housed rats were placed in cages as described and allowed to interact directly for 1 h per day, but were separated by dividers that allowed sensory but not physical contact for the remaining 23 h. Panels B and D are from blood samples taken 7 weeks after initiation of triad housing, 15 weeks after initial restraint test. Significant differences between pre- (dark shaded bars) and post-restraint (light shaded bars) samples within housing and social rank status are indicated by *p < 0.05; **p < 0.01; ***p < 0.001. Values are shown relative to established social rank in triads, indicated by “Dom”, socially dominant rats, “Subdom” subdominant rats, “Subord”, subordinant rats, or “Single”, singly housed rats. The percent increase in corticosterone induced by restraint of long-term triad housed rats, indicated by numbers in post-restraint bars, was significantly greater (p < 0.01) than in rats tested 8 weeks prior to triad formation. The percent increase in osteocalcin induced by restraint did not differ between tests and is not shown.

Figure 3 Effect of social interaction at the initiation of triad housing on plasma corticosterone (A) and osteocalcin (B) concentrations (mean ± SEM). Social rank was determined as defined in , based on observations during this 1 h test. Blood was obtained from tail cuts one day before change of housing conditions and again 24 h after rats were placed in their respective triad or single caging. Values are shown relative to established social rank in triads, or single housing. **p < 0.01, from baseline within social rank.
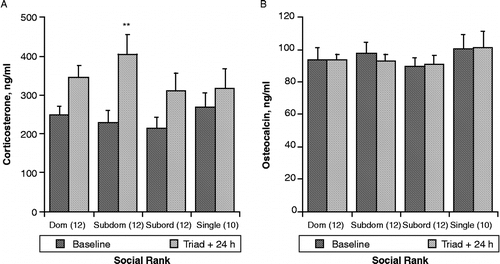
Figure 3 Effect of social interaction at the initiation of triad housing on plasma corticosterone (A) and osteocalcin (B) concentrations (mean ± SEM). Social rank was determined as defined in Figure 2, based on observations during this 1 h test. Blood was obtained from tail cuts one day before change of housing conditions and again 24 h after rats were placed in their respective triad or single caging. Values are shown relative to established social rank in triads, or single housing. **p < 0.01, from baseline within social rank.

Figure 4 Plasma corticosterone (A), leptin (B), and osteocalcin (C) concentrations (mean ± SEM) in trunk blood collected after a final 1 h social interaction at the termination of the experiment. Social rank was defined as described in , and was re-evaluated several times during the experiment to monitor potential changes in social hierarchy. Values are shown relative to established social rank in triads, or single housing. Corticosterone and osteocalcin concentrations did not differ among groups; however, there was a trend toward a dominance related decrease in leptin concentrations, p = 0.072.
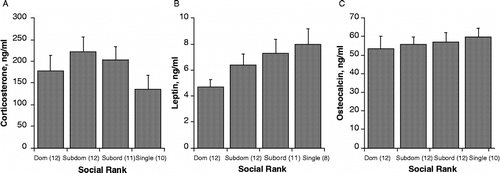
Figure 4 Plasma corticosterone (A), leptin (B), and osteocalcin (C) concentrations (mean ± SEM) in trunk blood collected after a final 1 h social interaction at the termination of the experiment. Social rank was defined as described in Figure 2, and was re-evaluated several times during the experiment to monitor potential changes in social hierarchy. Values are shown relative to established social rank in triads, or single housing. Corticosterone and osteocalcin concentrations did not differ among groups; however, there was a trend toward a dominance related decrease in leptin concentrations, p = 0.072.

Reprints and Corporate Permissions

Please note: Selecting permissions does not provide access to the full text of the article, please see our help page How do I view content?

To request a reprint or corporate permissions for this article, please click on the relevant link below:

Academic Permissions

Please note: Selecting permissions does not provide access to the full text of the article, please see our help page How do I view content?

Obtain permissions instantly via Rightslink by clicking on the button below:

If you are unable to obtain permissions via Rightslink, please complete and submit this Permissions form. For more information, please visit our Permissions help page.