Figures & data
Figure 1 State anxiety levels (mean and standard deviations) as a function of condition and time (n = 10 per experimental condition). Single asterisks indicate a significant difference between times or groups (p < 0.05).
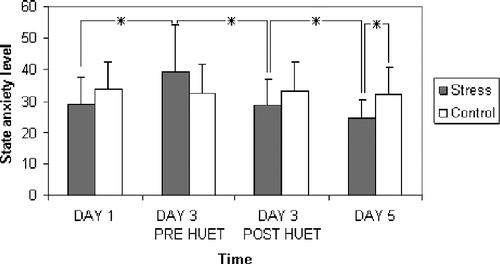
Table I. Mean (with standard deviation) operation-word span scores for HUET and control group over three test sessions (n=10 per experimental condition).
Figure 2 Salivary cortisol concentrations (mean and standard error) as a function of time and condition (n = 10 per experimental condition). Post-HUET is 25 min after the stressor. Single asterisks indicate a significant difference between time points (p < 0.05) and a single diamond indicates a significant difference between groups (p < 0.05).
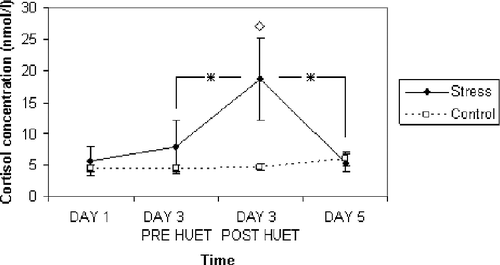
Figure 3 State anxiety levels (mean and standard deviations) as a function of condition and time (n = 10 per experimental condition). A single diamond indicates a significant difference between groups (p < 0.05).
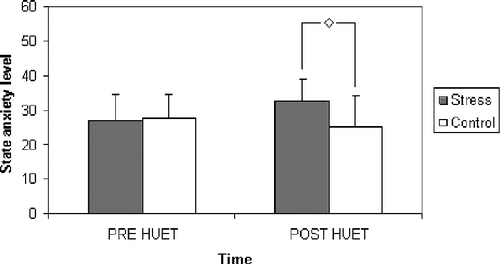
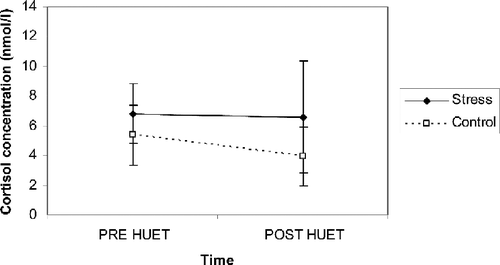
Figure 4 Salivary cortisol concentrations (mean and standard error) as a function of time and condition (n = 10 per experimental condition). Post-HUET is immediately after the stressor.