Publication Cover
Stress
The International Journal on the Biology of Stress
Volume 11, 2008 - Issue 4
1,143
Views
119
CrossRef citations to date
0
Altmetric
Original

Acute episodes of predator exposure in conjunction with chronic social instability as an animal model of post-traumatic stress disorder

, , &
Pages 259-281 | Received 06 Jul 2007, Accepted 18 Oct 2007, Published online: 07 Jul 2009

Figures & data

Figure 1 Timeline and procedures for Experiments 1–4. In Experiment 1, all rats were acclimated to the HR/BP apparatus prior to the experimental manipulations. Subsequently, rats were exposed to two acute stress sessions, comprised of immobilization during cat exposure (psychosocial stress; cat icon; n = 8) or home cage exposure (no psychosocial stress; rat cage icon; n = 10), that were separated by 10 days. We obtained blood samples and cardiovascular measurements from all rats following each of the two acute stress sessions. Psychosocially stressed rats were also given unstable housing conditions from Day 1 until the beginning of behavioral testing, which occurred three weeks after the second cat exposure. In Experiment 2, we repeated the explicit stress procedures from Experiment 1 (n = 10 per group) without performing blood sampling and cardiovascular measurements after each of the acute stress sessions. On Day 32, we assessed the effects of this paradigm on growth rate, as well as adrenal gland and thymus weight. In Experiment 3, groups of rats were given: (1) two inescapable cat exposures, in conjunction with daily social stress (psychosocial stress; n = 8), (2) two inescapable cat exposures, alone (cat only; n = 10), (3) two exposures to home cage, in conjunction with daily social stress (social stress only; n = 10) or (4) two exposures to home cage, alone (no psychosocial stress; n = 8) to determine whether both stress manipulations (i.e., inescapable cat exposure and daily social stress) were necessary to produce the observed effects on rat physiology and behavior. In Experiment 4, two groups of rats (psychosocial stress, n = 19 and no psychosocial stress, n = 20) were exposed to the same manipulations employed in Experiment 2. On Days 32 and 33, a subsection of each group of rats was injected with yohimbine (YOH: 10 and 12, respectively) or vehicle (VEH: 9 and 8, respectively) prior to behavioral testing.
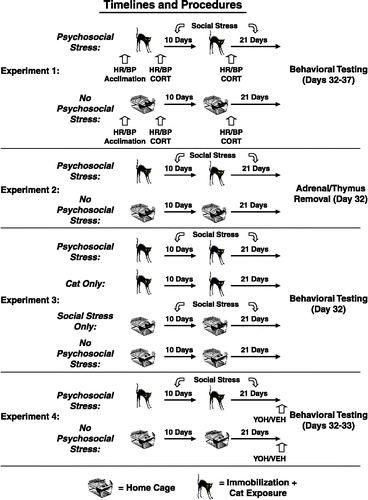
Figure 1 Timeline and procedures for Experiments 1–4. In Experiment 1, all rats were acclimated to the HR/BP apparatus prior to the experimental manipulations. Subsequently, rats were exposed to two acute stress sessions, comprised of immobilization during cat exposure (psychosocial stress; cat icon; n = 8) or home cage exposure (no psychosocial stress; rat cage icon; n = 10), that were separated by 10 days. We obtained blood samples and cardiovascular measurements from all rats following each of the two acute stress sessions. Psychosocially stressed rats were also given unstable housing conditions from Day 1 until the beginning of behavioral testing, which occurred three weeks after the second cat exposure. In Experiment 2, we repeated the explicit stress procedures from Experiment 1 (n = 10 per group) without performing blood sampling and cardiovascular measurements after each of the acute stress sessions. On Day 32, we assessed the effects of this paradigm on growth rate, as well as adrenal gland and thymus weight. In Experiment 3, groups of rats were given: (1) two inescapable cat exposures, in conjunction with daily social stress (psychosocial stress; n = 8), (2) two inescapable cat exposures, alone (cat only; n = 10), (3) two exposures to home cage, in conjunction with daily social stress (social stress only; n = 10) or (4) two exposures to home cage, alone (no psychosocial stress; n = 8) to determine whether both stress manipulations (i.e., inescapable cat exposure and daily social stress) were necessary to produce the observed effects on rat physiology and behavior. In Experiment 4, two groups of rats (psychosocial stress, n = 19 and no psychosocial stress, n = 20) were exposed to the same manipulations employed in Experiment 2. On Days 32 and 33, a subsection of each group of rats was injected with yohimbine (YOH: 10 and 12, respectively) or vehicle (VEH: 9 and 8, respectively) prior to behavioral testing.

Table I.  Mean growth rate (g/day, mean±SEM) of rats during the 31-day period from stress session 1 to the first day of behavioral/physiological testing.

Figure 2 Cardiovascular activity and serum corticosterone following each stress session in Experiment 1. The psychosocial stress group displayed greater HR (top left), systolic BP (top right), diastolic BP (bottom right) and serum corticosterone concentrations (bottom left) than the no psychosocial stress group following each stress session. Additionally, the psychosocial stress group demonstrated significantly greater systolic and diastolic BP after the second stress session, relative to the first stress session. *p < 0.05; **p < 0.01; ***p < 0.0001 versus the no psychosocial stress group. Data are group means ± SEM.
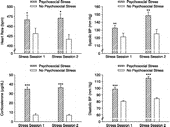
Figure 2 Cardiovascular activity and serum corticosterone following each stress session in Experiment 1. The psychosocial stress group displayed greater HR (top left), systolic BP (top right), diastolic BP (bottom right) and serum corticosterone concentrations (bottom left) than the no psychosocial stress group following each stress session. Additionally, the psychosocial stress group demonstrated significantly greater systolic and diastolic BP after the second stress session, relative to the first stress session. *p < 0.05; **p < 0.01; ***p < 0.0001 versus the no psychosocial stress group. Data are group means ± SEM.

Figure 3 Elevated plus maze and startle response data from Experiment 1. The psychosocial stress group spent significantly less time in the open arms of the elevated plus maze than the no psychosocial stress group (top left). This was despite finding that the two groups demonstrated comparable motor activity on the elevated plus maze (top right). The psychosocial stress group also demonstrated greater startle responses than the no psychosocial stress group to the 90 and 110 dB, but not 100 dB, auditory stimuli (bottom). *p < 0.05; **p < 0.001 versus the no psychosocial stress group. Data are group means ± SEM.
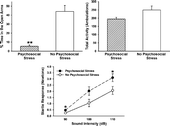
Figure 3 Elevated plus maze and startle response data from Experiment 1. The psychosocial stress group spent significantly less time in the open arms of the elevated plus maze than the no psychosocial stress group (top left). This was despite finding that the two groups demonstrated comparable motor activity on the elevated plus maze (top right). The psychosocial stress group also demonstrated greater startle responses than the no psychosocial stress group to the 90 and 110 dB, but not 100 dB, auditory stimuli (bottom). *p < 0.05; **p < 0.001 versus the no psychosocial stress group. Data are group means ± SEM.

Figure 4 Novel object recognition training and testing data from Experiment 1. During training, the psychosocial stress and no psychosocial stress groups spent a comparable amount of time with Object 1 and Object 2, indicating no preference for one object over the other (left). Three hours later, the no psychosocial stress group spent more time with the novel than the familiar object, but the psychosocial stress group spent a comparable amount of time with each object (right). *p < 0.05 versus familiar object. Data are group means ± SEM.

Figure 4 Novel object recognition training and testing data from Experiment 1. During training, the psychosocial stress and no psychosocial stress groups spent a comparable amount of time with Object 1 and Object 2, indicating no preference for one object over the other (left). Three hours later, the no psychosocial stress group spent more time with the novel than the familiar object, but the psychosocial stress group spent a comparable amount of time with each object (right). *p < 0.05 versus familiar object. Data are group means ± SEM.

Figure 5 Cardiovascular responses and serum corticosterone on the final day of behavioral testing in Experiment 1. The psychosocial stress group displayed reduce HR (top left), greater systolic BP (top right) and greater diastolic BP (bottom right) than the no psychosocial stress group following 20 min of restraint stress. The psychosocial stress group exhibited marginally reduced baseline levels of corticosterone than the no psychosocial stress group, and both groups demonstrated elevated corticosterone levels following 20 min of acute restraint stress, which is indicated by the dark black line from 30–50 min(bottom left). βp < 0.09; *p < 0.05; **p < 0.001 versus the no psychosocial stress group. Data are group means ± SEM.
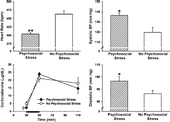
Figure 5 Cardiovascular responses and serum corticosterone on the final day of behavioral testing in Experiment 1. The psychosocial stress group displayed reduce HR (top left), greater systolic BP (top right) and greater diastolic BP (bottom right) than the no psychosocial stress group following 20 min of restraint stress. The psychosocial stress group exhibited marginally reduced baseline levels of corticosterone than the no psychosocial stress group, and both groups demonstrated elevated corticosterone levels following 20 min of acute restraint stress, which is indicated by the dark black line from 30–50 min(bottom left). βp < 0.09; *p < 0.05; **p < 0.001 versus the no psychosocial stress group. Data are group means ± SEM.

Figure 6 Adrenal gland and thymus weights from Experiment 2. Data are shown as actual weights (left side of each figure) and relative weights expressed as mg/100 g body weight (right side of each figure). Three weeks after the second cat exposure, the psychosocial stress group demonstrated a smaller thymus (top) and larger adrenal glands (bottom) than the no psychosocial stress group. *p < 0.05; **p < 0.01 versus the no psychosocial stress group. Data are group means ± SEM.
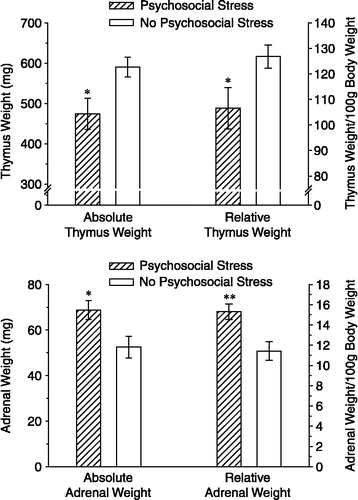
Figure 6 Adrenal gland and thymus weights from Experiment 2. Data are shown as actual weights (left side of each figure) and relative weights expressed as mg/100 g body weight (right side of each figure). Three weeks after the second cat exposure, the psychosocial stress group demonstrated a smaller thymus (top) and larger adrenal glands (bottom) than the no psychosocial stress group. *p < 0.05; **p < 0.01 versus the no psychosocial stress group. Data are group means ± SEM.

Figure 7 Elevated plus maze growth rate and startle response data from Experiment 3. Only the cat exposure + social stress group spent significantly less time in the open arms of the elevated plus maze (top left) and exhibited significantly reduced growth rate (top right), relative to the no stress group. The social stress only group displayed greater motor activity on the elevated plus maze than all other groups (bottom left). Only the social stress + cat exposure group exhibited greater startle responses than the no stress group to the 100 and 110 dB auditory stimuli (bottom right). *p < 0.05 versus the no stress group; **p < 0.05 versus all other groups; ***p < 0.01 versus the no stress group. Data are group means ± SEM.
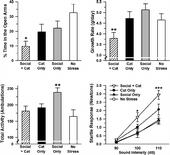
Figure 7 Elevated plus maze growth rate and startle response data from Experiment 3. Only the cat exposure + social stress group spent significantly less time in the open arms of the elevated plus maze (top left) and exhibited significantly reduced growth rate (top right), relative to the no stress group. The social stress only group displayed greater motor activity on the elevated plus maze than all other groups (bottom left). Only the social stress + cat exposure group exhibited greater startle responses than the no stress group to the 100 and 110 dB auditory stimuli (bottom right). *p < 0.05 versus the no stress group; **p < 0.05 versus all other groups; ***p < 0.01 versus the no stress group. Data are group means ± SEM.

Figure 8 Open field, elevated plus maze and startle findings from Experiment 4. In open field testing, yohimbine treatment (1 mg/kg, i.p.) suppressed rearing in the no psychosocial stress group (NS-YOH), an effect that was significantly exacerbated by prior stress experience (S-YOH) (top left). On the elevated plus maze, both psychosocial stress groups (S-YOH, S-VEH) spent significantly less time in the open arms than the no psychosocial stress groups (NS-YOH, NS-VEH) (top right). In addition, only the yohimbine-treated psychosocial stress group (S-YOH) exhibited significantly less motor activity on the elevated plus maze than the vehicle-treated no psychosocial stress group (NS-VEH) (bottom left). Psychosocial stress significantly increased startle responses to the 100 and 110 dB auditory stimuli (bottom right). *p < 0.01 versus all other groups; **p < 0.0001 versus the no psychosocial stress groups; ***p < 0.01 versus the vehicle-treated no psychosocial stress group; βp < 0.05 versus the respective no psychosocial stress groups. Data are group means ± SEM.
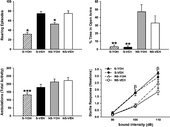
Figure 8 Open field, elevated plus maze and startle findings from Experiment 4. In open field testing, yohimbine treatment (1 mg/kg, i.p.) suppressed rearing in the no psychosocial stress group (NS-YOH), an effect that was significantly exacerbated by prior stress experience (S-YOH) (top left). On the elevated plus maze, both psychosocial stress groups (S-YOH, S-VEH) spent significantly less time in the open arms than the no psychosocial stress groups (NS-YOH, NS-VEH) (top right). In addition, only the yohimbine-treated psychosocial stress group (S-YOH) exhibited significantly less motor activity on the elevated plus maze than the vehicle-treated no psychosocial stress group (NS-VEH) (bottom left). Psychosocial stress significantly increased startle responses to the 100 and 110 dB auditory stimuli (bottom right). *p < 0.01 versus all other groups; **p < 0.0001 versus the no psychosocial stress groups; ***p < 0.01 versus the vehicle-treated no psychosocial stress group; βp < 0.05 versus the respective no psychosocial stress groups. Data are group means ± SEM.

Figure 9 Serum corticosterone responses in Experiment 4. On Day 33 of Experiment 4, rats were given yohimbine (1 mg/kg, i.p.) or vehicle. The psychosocial stress and yohimbine-treated groups exhibited greater serum corticosterone concentrations 30 min post-injection (60 min time point) than the no psychosocial stress and vehicle-treated groups, respectively. Corticosterone levels were increased in all groups following 20 min of restraint (indicated by the dark black line between 60–80 min); the increases were greater in groups that had been psychosocially stressed and/or pre-treated with yohimbine. Psychosocial stress and yohimbine treatment had an additive effect on corticosterone levels at each of the first two time points: the group that had been psychosocially stressed and pre-treated with yohimbine (S-YOH) exhibited the greatest corticosterone levels at both time points. While corticosterone levels of the two vehicle-treated groups (S-VEH, NS-VEH) significantly declined 60 min following the cessation of immobilization, those of the two yohimbine-treated groups (S-YOH, NS-YOH) remained elevated. *p < 0.05 versus the no psychosocial stress-vehicle group; **p < 0.05 versus psychosocial stress-vehicle and no psychosocial stress-vehicle groups; ***p < 0.05 versus all other groups. Data are group means ± SEM.
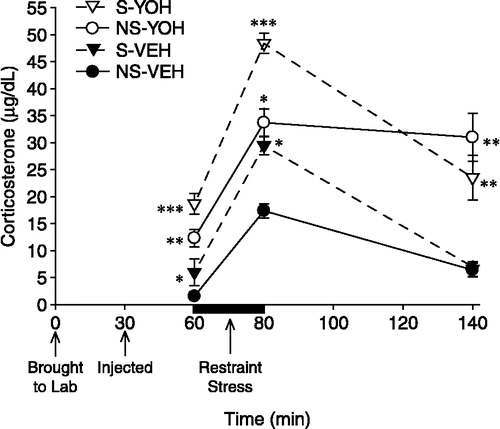
Figure 9 Serum corticosterone responses in Experiment 4. On Day 33 of Experiment 4, rats were given yohimbine (1 mg/kg, i.p.) or vehicle. The psychosocial stress and yohimbine-treated groups exhibited greater serum corticosterone concentrations 30 min post-injection (60 min time point) than the no psychosocial stress and vehicle-treated groups, respectively. Corticosterone levels were increased in all groups following 20 min of restraint (indicated by the dark black line between 60–80 min); the increases were greater in groups that had been psychosocially stressed and/or pre-treated with yohimbine. Psychosocial stress and yohimbine treatment had an additive effect on corticosterone levels at each of the first two time points: the group that had been psychosocially stressed and pre-treated with yohimbine (S-YOH) exhibited the greatest corticosterone levels at both time points. While corticosterone levels of the two vehicle-treated groups (S-VEH, NS-VEH) significantly declined 60 min following the cessation of immobilization, those of the two yohimbine-treated groups (S-YOH, NS-YOH) remained elevated. *p < 0.05 versus the no psychosocial stress-vehicle group; **p < 0.05 versus psychosocial stress-vehicle and no psychosocial stress-vehicle groups; ***p < 0.05 versus all other groups. Data are group means ± SEM.

Reprints and Corporate Permissions

Please note: Selecting permissions does not provide access to the full text of the article, please see our help page How do I view content?

To request a reprint or corporate permissions for this article, please click on the relevant link below:

Academic Permissions

Please note: Selecting permissions does not provide access to the full text of the article, please see our help page How do I view content?

Obtain permissions instantly via Rightslink by clicking on the button below:

If you are unable to obtain permissions via Rightslink, please complete and submit this Permissions form. For more information, please visit our Permissions help page.