Figures & data
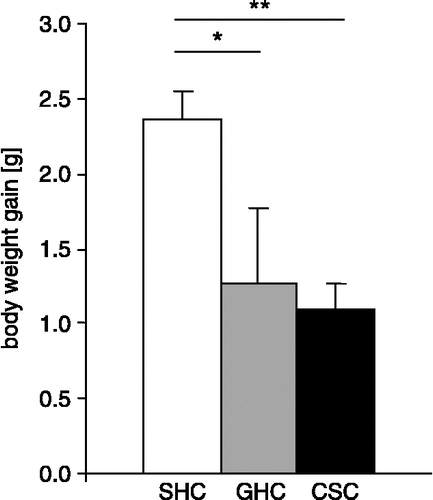
Figure 1 Effects of 19-day exposure to different housing conditions (SHCs, n = 17; GHCs, n = 9; CSC, n = 16) on body weight gain in male mice. Data represent means + SEM; *p ≤ 0.05; **p ≤ 0.01 vs. SHC group.

Figure 2 Effects of 19-day exposure to different housing conditions (SHCs, n = 9; GHCs, n = 8; CSC, n = 8) on the behavioral responses of male mice during subsequent OA exposure (day 20). Anxiety-related behavior during 10 min of OA exposure is indicated by (A) number of entries into the distal zone, risk assessment/exploratory behavior is indicated by (B) number of head dips on the distal zone, (C) number of total head dips on the OA, (D) time [s] of distal head dips, and locomotor behavior is indicated by (E) distance [cm] travelled on the OA and (F) shows number of grooming episodes. Data represent means + SEM; *p ≤ 0.05; **p ≤ 0.01 vs. SHC group.
![Figure 2 Effects of 19-day exposure to different housing conditions (SHCs, n = 9; GHCs, n = 8; CSC, n = 8) on the behavioral responses of male mice during subsequent OA exposure (day 20). Anxiety-related behavior during 10 min of OA exposure is indicated by (A) number of entries into the distal zone, risk assessment/exploratory behavior is indicated by (B) number of head dips on the distal zone, (C) number of total head dips on the OA, (D) time [s] of distal head dips, and locomotor behavior is indicated by (E) distance [cm] travelled on the OA and (F) shows number of grooming episodes. Data represent means + SEM; *p ≤ 0.05; **p ≤ 0.01 vs. SHC group.](/cms/asset/7acac311-234b-42f3-b9ce-286b3e709694/ists_a_304376_f0002_b.gif)
Table I. Effects of CSC exposure on c-Fos expression in all analyzed brain areas under basal conditions and in response to OA exposure (except brain regions separately illustrated in Figure 3). Used tissue area: 0.02, 0.04, and 0.08 mm2 (depending on size of brain area); (In central amygdala, pyramidal cell layer and dentate gyrus c-Fos positive cells were counted throughout the whole brain area). Values represent the means ± SEM of c-Fos positive cells; n=6–7 (basal groups), n=6–10 (OA exposure groups); ap≤0.05, bp≤0.01 vs. respective basal group.
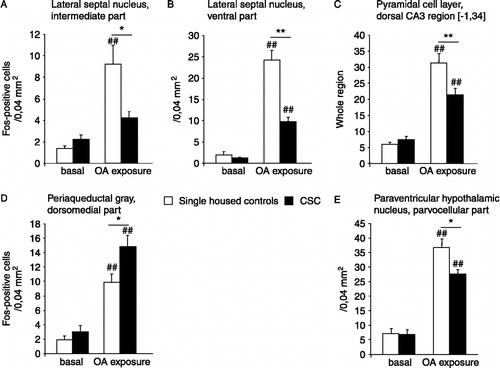
Figure 3 Effects of CSC housing in male mice on c-Fos expression under basal conditions and in response to OA exposure. Displayed are those five brain areas in which statistically significant differences after OA exposure were observed between the groups. Data represent means + SEM; ##p ≤ 0.01 vs. respective basal group; *p ≤ 0.05, **p ≤ 0.01 vs. respective SHC group.

Table II. Effects of CSC exposure on Zif-268 expression in all analyzed brain areas under basal conditions and in response to OA exposure. Used tissue area: 0.04 mm2; Values represent the means ± SEM of Zif–268 positive cells; n=7 (basal groups), n=8 (OA exposure groups); ap≤0.05, bp≤0.01 vs. respective basal group; cp≤0.05, dp≤0.01 vs. respective SHC group.
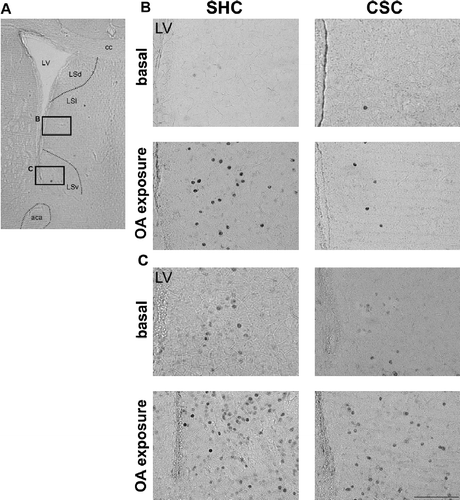
Figure 4 Representative photomicrographs of immunoreactivity in sub-regions of the LS. (A) Low magnification overview of the LS at the level of +0.86 (bregma) based on the atlas of Paxinos and Watson (Citation1998). Boxed areas are shown at high magnification. Bright field photomicrographs in representative sections matched for comparable rostrocaudal levels: (B) c-Fos expression of SHC and CSC mice before (basal) and after OA exposure in the intermediate LS (LSi). (C) Zif-268 expression of SHC and CSC mice before (basal) and after OA exposure in the ventral LS (LSv). Scale bar = 100μm; aca, anterior commissure; cc, corpus callosum; LSd, dorsal lateral septum; and LV, lateral ventricle.
