Figures & data
Figure 1 (A) Schematic depicting expression of imidazoline binding sites in the rat brain as determined by receptor autoradiography using [3H]BU224 (I2 selective ligand), [3H]2BFI (I2 selective ligand) and [3H] rilmenidine (I1 selective ligand). The regions highlighted have been shown to express a moderate to high density of imidazoline binding sites (King et al. Citation1995; Lione et al. Citation1998; Robinson et al. Citation2002; Tyacke et al. 2002). The figure also summarises the effects of imidazoline binding site activation on neuronal firing and terminal release of monoamines in these regions. I1 (red) and I2 (blue) binding sites are colocalised (purple) in some brain regions. (B) Schematic depicting [3H]harmane binding (green) in discrete rat brain regions and the effects of harmane administration on neuronal firing and terminal release of monoamines in these regions. Harmane is a putative endogenous IBS ligand. Abbreviations used: 5-HT, serotonin; AP, area postrema; Arc, arcuate nucleus; CG, central grey; Cx, Cortex; DR, dorsal raphe; DM, dorsomedial hypothalamic nucleus; Fr, frontal cortex; ICV, intracerebroventricular; IP, interpeduncular nucleus; LC, locus coeruleus; LM, lateral mammillary nucleus; LS, lateral septal nucleus; MHb, medial habenular nucleus; NA, noradrenaline; Occ, occipital cortex; Pi, pineal gland; PVN, paraventricular nucleus (hypothalamus); Sol, nucleus of the solitary tract; SuG, superficial gray layer of the superior colliculus; VMH, ventromedial hypothalamic nucleus and 12, hypoglossal nucleus.
![Figure 1 (A) Schematic depicting expression of imidazoline binding sites in the rat brain as determined by receptor autoradiography using [3H]BU224 (I2 selective ligand), [3H]2BFI (I2 selective ligand) and [3H] rilmenidine (I1 selective ligand). The regions highlighted have been shown to express a moderate to high density of imidazoline binding sites (King et al. Citation1995; Lione et al. Citation1998; Robinson et al. Citation2002; Tyacke et al. 2002). The figure also summarises the effects of imidazoline binding site activation on neuronal firing and terminal release of monoamines in these regions. I1 (red) and I2 (blue) binding sites are colocalised (purple) in some brain regions. (B) Schematic depicting [3H]harmane binding (green) in discrete rat brain regions and the effects of harmane administration on neuronal firing and terminal release of monoamines in these regions. Harmane is a putative endogenous IBS ligand. Abbreviations used: 5-HT, serotonin; AP, area postrema; Arc, arcuate nucleus; CG, central grey; Cx, Cortex; DR, dorsal raphe; DM, dorsomedial hypothalamic nucleus; Fr, frontal cortex; ICV, intracerebroventricular; IP, interpeduncular nucleus; LC, locus coeruleus; LM, lateral mammillary nucleus; LS, lateral septal nucleus; MHb, medial habenular nucleus; NA, noradrenaline; Occ, occipital cortex; Pi, pineal gland; PVN, paraventricular nucleus (hypothalamus); Sol, nucleus of the solitary tract; SuG, superficial gray layer of the superior colliculus; VMH, ventromedial hypothalamic nucleus and 12, hypoglossal nucleus.](/cms/asset/45c04eef-1173-4fa7-ac25-f90e551d577f/ists_a_330457_f0001_b.gif)
Table I. Modulation of brain monoamine activity by IBS ligandsa in rodents in vivo.
Figure 2 Effect of systemic (i.p., imraperitoneal) administration of the selective I2 IBS ligand, BU224, on (A) extracellular levels of NA in the hypothalamic PVN region and (B) plasma corticosterone concentrations in control rats and rats with adjuvant-induced arthritis (AA; a chronic stressor). Values are expressed as means ± s.e.m. **p < 0.01, *p < 0.05 comparing post-injection levels with basal levels in the Con + BU224 group; +p < 0.05, ++p < 0.01 comparing post-injection levels with basal levels in the AA + BU224 group; $p < 0.05 comparing AA + BU224 with Con + BU224 group at 60 min. Con, Control; Sal, Saline vehicle. Reproduced with permission from Finn et al. (Citation2002).
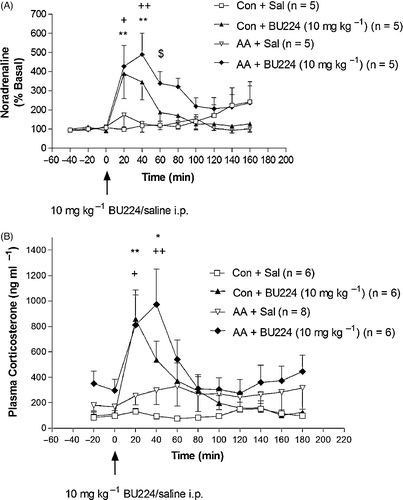
Figure 3 Effects of the selective I2 binding site ligand BU224 (10 mg/kg, i.p.) on plasma corticosterone concentrations in control and restraint-stressed rats. Results are expressed as means ± s.e.m. (n = 5–7). **p < 0.01 and ++p < 0.01 compared with saline-treated controls at 30 and 60 min, respectively. ‡p < 0.05 and †p < 0.01 compared with BU224-treated controls (not restrained) at 30 and 60 min, respectively. $$p < 0.05 compared with saline-treated restrained rats at 60 min. Sal + Con, Saline + Control (no restraint); BU + Con: BU224 + Control; Sal + Res, Saline + Restraint; and BU + Res, BU224 + Restraint. Reproduced with permission from Finn et al. (Citation2004).
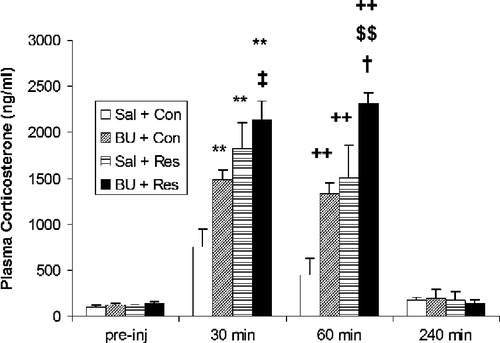
Table II. Modulation of stress hormones by IBS ligands.