Figures & data
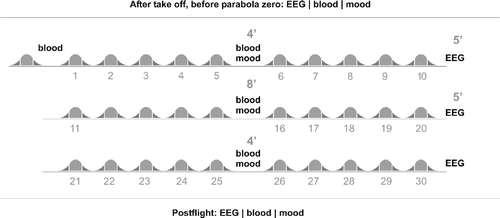
Figure 1 Flight procedure. After take off, prior to parabola zero, EEG recording, blood collection and assessment of mood state took place. EEG recording was repeated after parabolas 10, 20 and 30. Blood collection and mood assessment were repeated after parabolas 5, 15 and 25. Thirty minutes post-flight another data set of EEG, blood and mood data were collected. Each of the 31 parabolas is marked by two hyper-gravity phases (dark grey) and a zero-gravity phase (light grey).

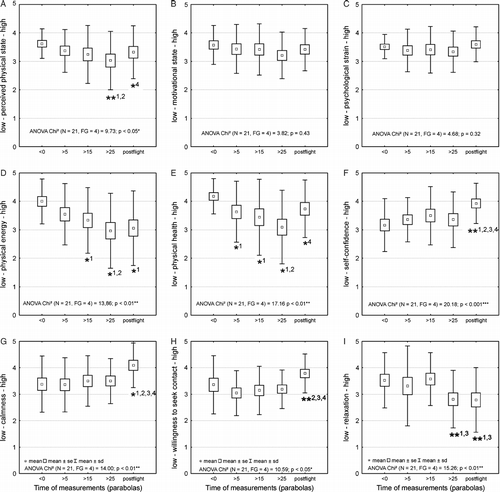
Figure 2 Perceived physical state (A), motivational state (B), psychological strain (C), physical energy (D), physical health (E), self-confidence (F), calmness (G), willingness to seek contact (H) and relaxation (I) for measurements nos. 1–4 in-flight and measurement no. 5 30 min post-flight. Data show means (small box), standard error (large box) and standard deviation (bar). Stars indicate significant changes (*p < 0.05; **p < 0.01) followed by: 1 different to 1st measurement, 2 different to 2nd measurement, 3 different to 3rd measurement, 4 different to fourth measurement, 5 different to fifth measurement.

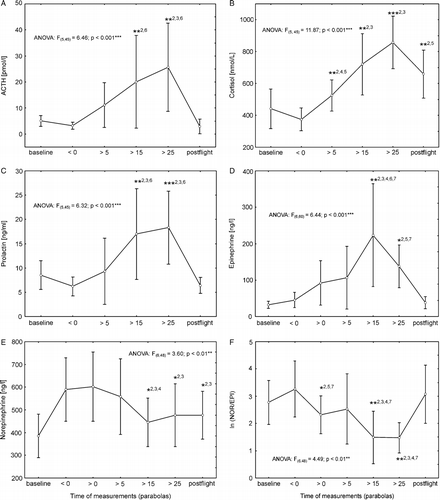
Figure 3 Progression of plasma hormone concentrations from baseline through parabolic flight to post-flight measurements (first to sixth for (A) ACTH, (B) COR, (C) prolactin; and from first to seventh samples for (D) epinephrine, (E) norepinephrine, and (F) NOR/EP ratiosI). Data show means ± 95% confidence intervals. Asterisks indicate significant changes (*p < 0.05; **p < 0.01) followed by: 1 versus first measurement, 2 versus second measurement, 3 versus third measurement, 4 versus fourth measurement, 5 versus fifth measurement, 6 versus sixth measurement.

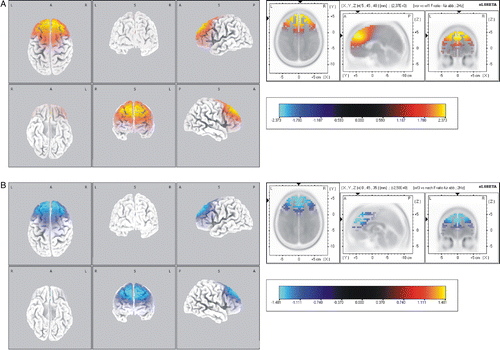
Figure 4 Standardised low resolution brain electromagnetic tomography (sLORETA) differences in the EEG β1 frequency band during parabolic flight. Comparisons of (A) pre-flight activity and in-flight activity, and (B) in-flight activity and post-flight activity (B), respectively. Images depicting SPMs seen from different perspectives are based on voxel-by-voxel t-values of differences. Red colours indicate increased activity in the in-flight condition (A). Blue colours indicate decreased activity in the post-flight condition. Changes were found to be localised in the frontal lobe and medial frontal gyrus. Structural anatomy is shown in grey scale (L left, R right, A anterior, P posterior).

Figure 5 Correlations between subjective mood assessment and plasma hormone concentrations during parabolic flight. (A) cortisol (COR [μg/dl]); (B) ACTH [pmol/l]; (C) prolactin (PRL [ng/ml]); (D) epinephrine (EPI [ng/l]); (E) norepinephrine (NOR [ng/l]), and perceived physical state (PEPS, left column), psychological strain (PSYCHO, middle column) and motivational state (MOT, right column). Solid line represents linear regression, dotted lines 95% confidence intervals. All correlations, except those with NOR/PEPS (D, column 1; p = 0.08), were significant (p < 0.05).
![Figure 5 Correlations between subjective mood assessment and plasma hormone concentrations during parabolic flight. (A) cortisol (COR [μg/dl]); (B) ACTH [pmol/l]; (C) prolactin (PRL [ng/ml]); (D) epinephrine (EPI [ng/l]); (E) norepinephrine (NOR [ng/l]), and perceived physical state (PEPS, left column), psychological strain (PSYCHO, middle column) and motivational state (MOT, right column). Solid line represents linear regression, dotted lines 95% confidence intervals. All correlations, except those with NOR/PEPS (D, column 1; p = 0.08), were significant (p < 0.05).](/cms/asset/9ef9d3b5-4125-43b0-9d60-80aa786955f7/ists_a_350085_f0005_b.gif)