Figures & data
Figure 1. Single degree of freedom sketches of the model pose before (a) and after (b) solving the orientation-based IK for a single time-frame. Experimental IMUs in green and corresponding virtual sensors in blue. Graphical offset in models position was manually added for clarity.
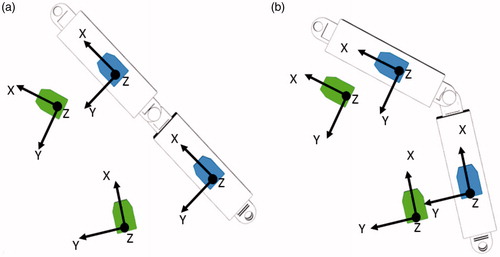
Figure 2. Experimental setups. Picture of the UR-10 robot with real IMUs placed (a). Picture of the custom-designed mechanism with both IMUs and passive markers placed (b). OpenSim model of the UR-10 robot (c) and of the custom-designed mechanism (d). In (c) and (d) virtual orientation sensors are placed on the models and numbered respectively A1 to A4 and B1 to B4. Joint names are also identified in both the models. UR-10 links’ length: . Custom-designed mechanism links’ length
.
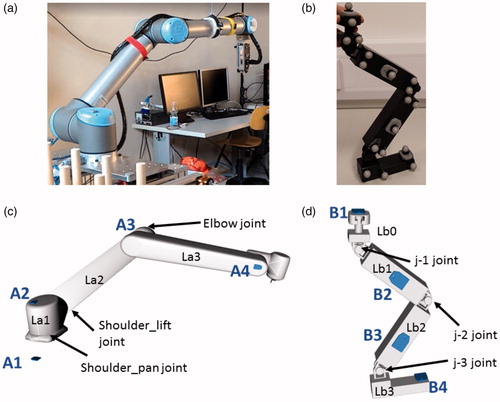
Figure 3. Flowchart reporting the quantities involved in the first validation framework and their relationship.
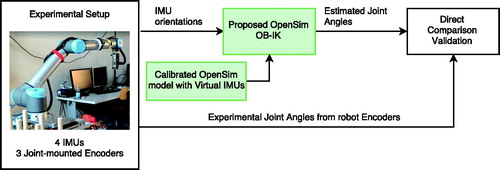
Figure 4. Flowchart reporting the quantities involved in the second validation framework and their relationship. Green boxes represent the workflow for orientation-based estimates, red ones for marker-based estimates.
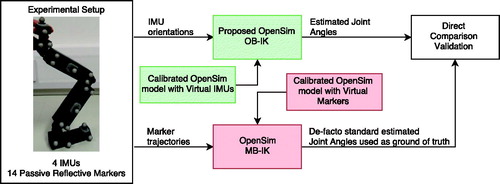
Table 1. Evaluation parameters for the validation against encoder measurements.
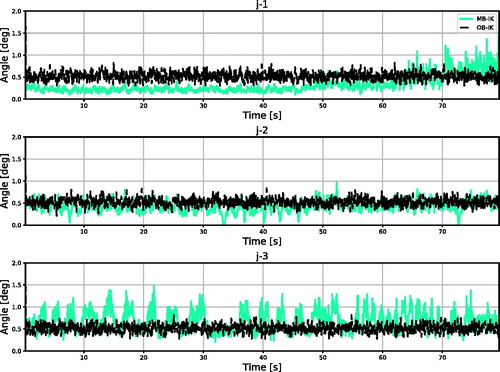
Figure 5. Orientation-based IK (dashed black) and encoder measured joint angles (cyan) during the trial TR_100 performed at maximum robot speed.
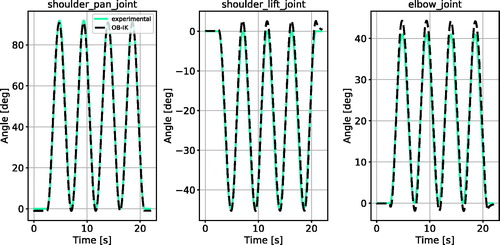
Figure 6. Left column: orientation-based IK (dashed black) and marker-based IK (cyan) joint angle estimates for TR_02 when joint j-2 and j-3 were moving contemporaneously and joint j-1 was manually kept steady. Right column: percentages of frames for each absolute error (AE) class over all the frames of the trial (blue) and over the frames corresponding to frames corresponding to joint accelerations and velocities compatible with the ones which characterize the human gait according to literature data (Winter Citation2009).
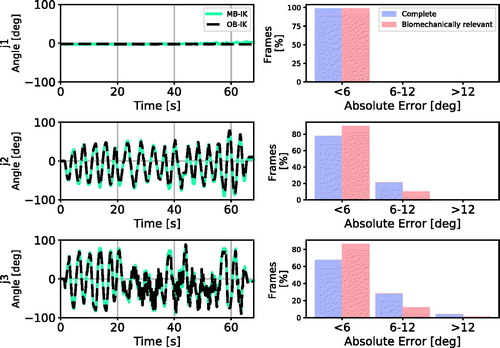
Table 2. Evaluation parameters for the validation against marker-based kinematics. TR_1 consisted in manually moving the joint j-1 and keeping steady the other joints.
Figure 7. Standard deviation of joint angle estimates over the 20 noisy trials for marker-based IK (cyan) and orientation-based IK (dashed black) during TR_03.