Figures & data
Figure 1. Taper mismatch scenarios.
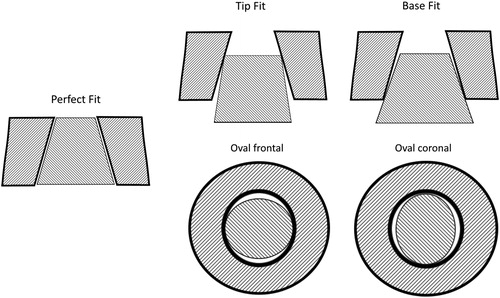
Figure 2. FE boundary conditions and loads.
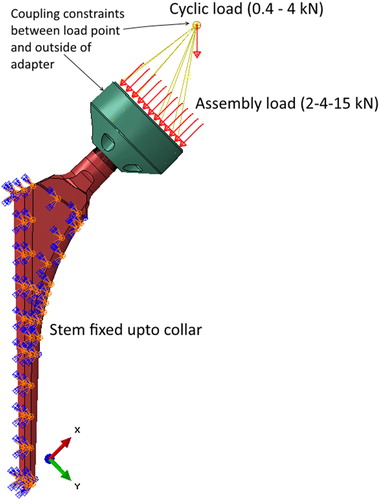
Figure 3. Micromotion plots for junctions assembled with 4 kN. The darkest red color indicates micromotion values which are above 70 µm.
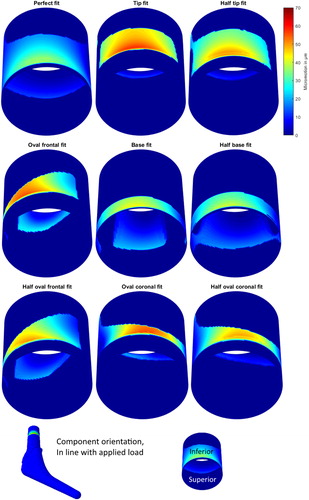
Figure 4. Contact pressures plots for junctions assembled with 4 kN.
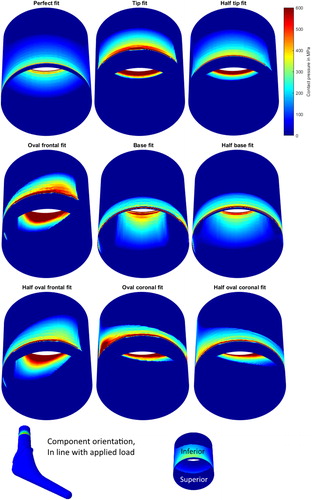
Figure 5. Plastic strain for 'Tip fit' assembled with 15 kN, and subsequently cyclic loaded, at the end of the simulation.
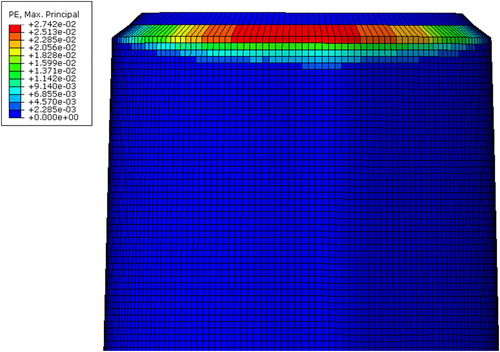
Figure 6. Wear depth contour plots, after simulation assembled with 4 kN.
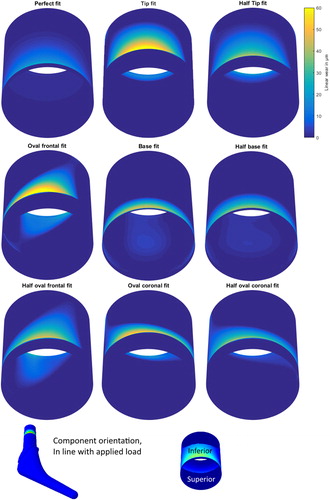
Figure 7. Initial wear rate up to 1 million cycles (left) and wear rate after 1 million cycles (right) for different tolerances and assembly forces. Lines are connected between 2, 4 and 15 kN assembly force to emphasize the trends found depending on the assembly force.
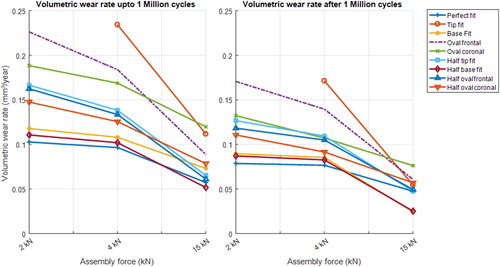
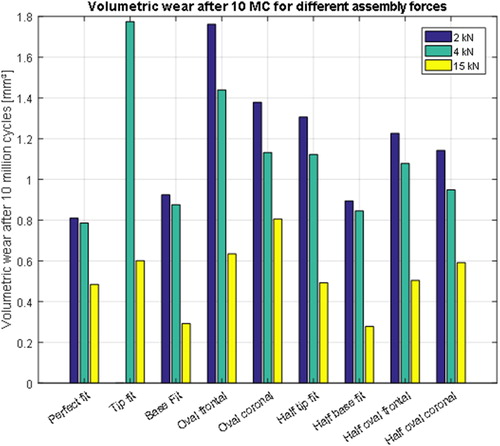
Figure 8. Volumetric wear after 10 million cycles.