Figures & data
Figure 1. Anteroposterior and axial radiograms of the patient after right-sided LCPD with obvious flattening of the articular surface in the anteroposterior direction; r represents the radius of the contour of the articular surface in the frontal plane, and r−δ represents the semiaxis of the elliptical contour in the sagittal plane. The axial radiograms were rotated to the extent that the vertical semiaxis of the ellipse in the sagittal plane (r, r−δ) was parallel to the horizontal semiaxis of the circle in the frontal plane.
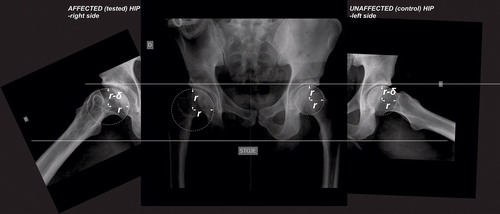
Table 1. Comparison of hips diagnosed with Legg Calve Perthes Disease in childhood and contralateral hips with respect to biomechanical and geometrical parameters.
Table 2. Comparison of hips with frontal radius of the articular sphere larger than 2.65 cm, and hips with frontal radius smaller than 2.65 cm with respect to biomechanical and geometrical parameters.
Table 3. Comparison of hips subjected to Legg Calve Perthes Disease with frontal radius of the articular sphere smaller than 2.65 cm and contralateral normal hips with frontal radius smaller than 2.65 cm, with respect to biomechanical and geometrical parameters.
Table 4. Comparison of dysplastic (Gp positive) and nondysplastic (Gp negative) hips according to the HIPSTRESS classification, with respect to biomechanical and geometrical parameters.
Table 5. Comparison of hips with ϑCE smaller than 20 degrees and normal hips with ϑCE larger than 20 degrees, with respect to biomechanical and geometrical parameters.
Table 6. Correlation coefficients and corresponding probabilities between parameters. All hips (255) were considered.
Figure 2. Correlation between deformation of the articular surface and radius of the femoral head in the frontal plane. Blue crosses pertain to hips subjected to Perthes Disease in childhood and red crosses pertain to control (contralateral) hips.
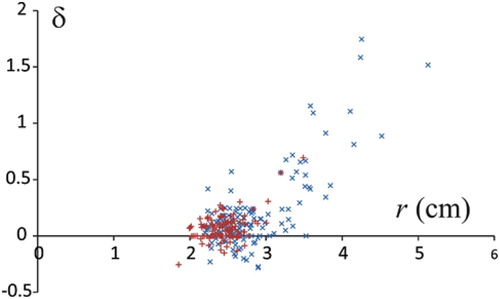
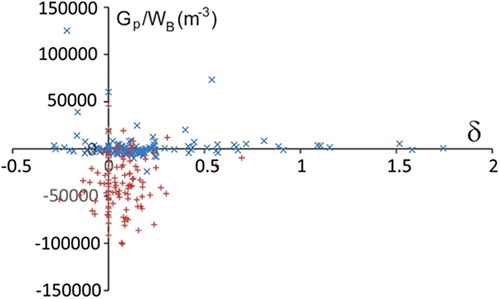
Figure 3. Correlation between index of stress gradient normalised with respect to body weight Gp/WBand deformation of the articular sphere δ. Blue crosses pertain to hips subjected to Perthes Disease in childhood and red crosses pertain to control (contralateral) hips.