Figures & data
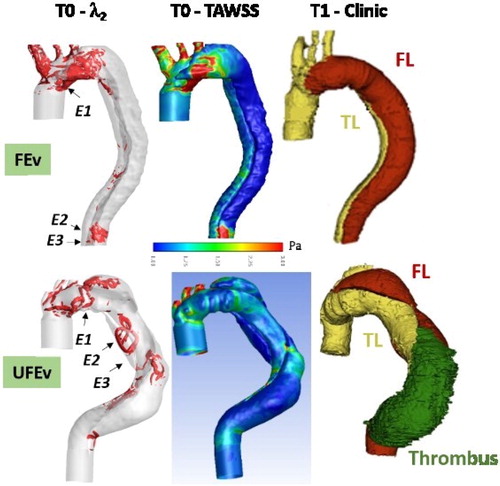
Figure 1. Velocity patterns during deceleration for FEv (top) and UFEv (bottom). Entry tear positions are identified by Ei (i = 1,2,3).
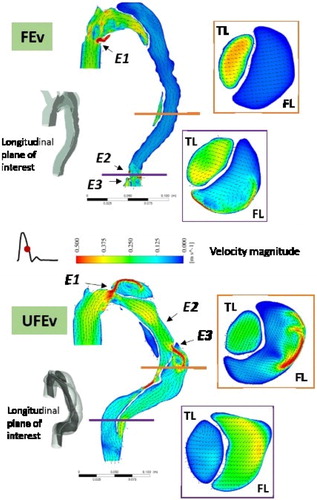
Figure 2. λ2 criterion during deceleration at T0, TAWSS at T0 and clinical events at T1, for FEv (top) and UFEv (bottom).