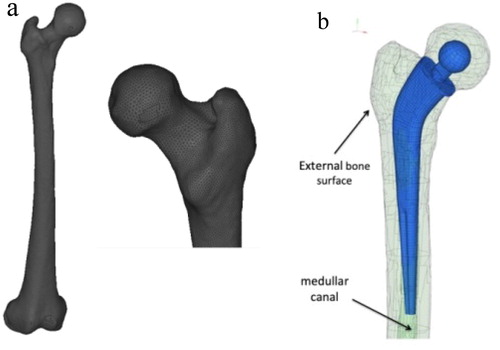
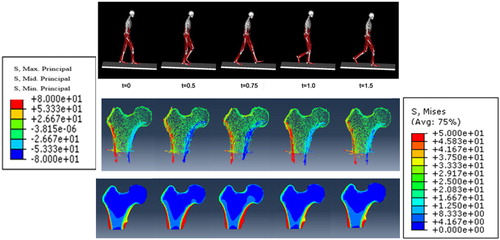
385
Views
0
CrossRef citations to date
0
Altmetric
Abstract

Evolution of mechanical fields during the gait cycle in healthy and implanted femoral bones

, , , , &

Figures & data

Figure 1. (a) Mesh of healthy femur (b) implant position.

Figure 1. (a) Mesh of healthy femur (b) implant position.

Figure 2. Five positions of the leg during gate and corresponding stress distribution in the femoral head.

Figure 2. Five positions of the leg during gate and corresponding stress distribution in the femoral head.