Figures & data
Figure 1. Elasticity maps (15 x 15 mm) obtained from the AFM protocol for slow (soleus, Sol: A-B) and fast (EDL: C-D) twitch muscle and tendon (E-F) of WT and TIEG1 KO fibers. The muscle and tendon fibers cartographies are represented by different colors which are representative of lower (blue/green) and higher (red/orange) elasticities.
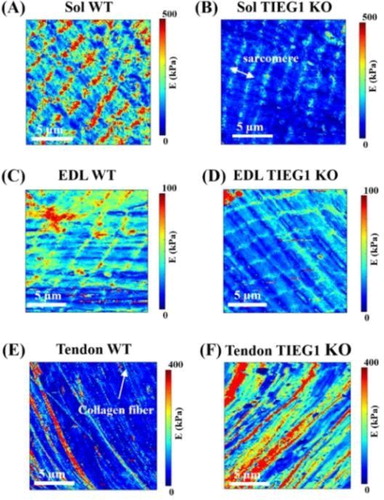
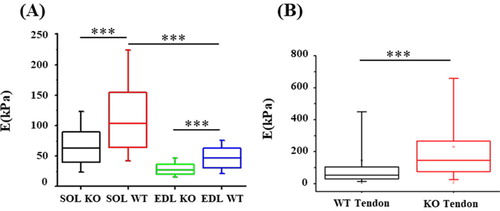
Figure 2. Quantification of Young modulus (E) obtained via AFM for WT (NWT_Tendon = 7, NWT_SOL = 7, NWT_EDL = 7) and TIEG1 KO (NKO_Tendon = 7, NKO_SOL = 7, NKO_EDL = 7) fibers. ***p < 0.001 between indicated groups.