321
Views
0
CrossRef citations to date
0
Altmetric
Abstract

Surface analysis during surgical balloon reduction of a tibial Plateau depression fracture

, , , , , , & show all

Figures & data

Figure 1. Bone surface with set of points after plateau tibial fracture.

Figure 1. Bone surface with set of points after plateau tibial fracture.

Figure 2. Analysis of surface markers during reduction.

Figure 2. Analysis of surface markers during reduction.

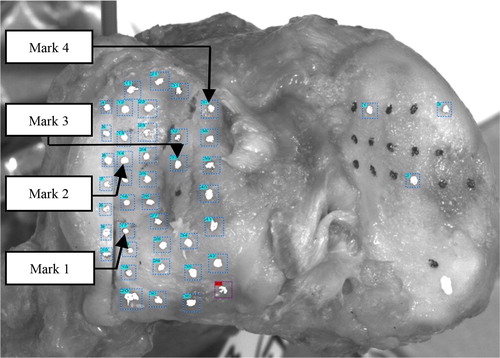
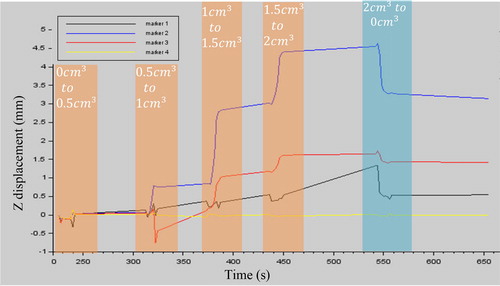
Figure 3. Z displacement (mm) of 4 markers () during inflations and deflation. The orange areas correspond to balloon inflation phases; the blue area corresponds to balloon deflation.

Figure 3. Z displacement (mm) of 4 markers (Figure 2) during inflations and deflation. The orange areas correspond to balloon inflation phases; the blue area corresponds to balloon deflation.