
Figures & data
Figure 1. Study overview: Three human lumbar IVDs were prepared (A) and scanned in a clinical 3 T MRI device (B). Using the acquired images, a finite element model was generated. The model is composed of isotropic NP and anisotropic AF elements including to distinct fibre families (C). The IVD joints were embedded in PMMA end-caps, and the mechanical compliance of the disc joints was measured in bending, flexion, extension, rotation (D) and tension (E). The measured load-displacement curves were used to calibrate the material properties of the FE model (F). Finally, a trans-endplate nucleotomy was performed and the testing procedure was repeated.
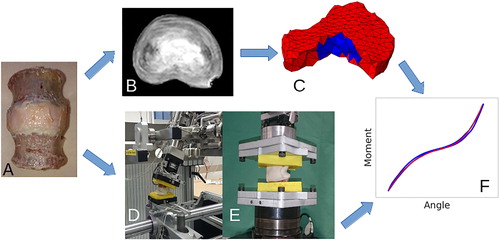
Figure 2. Definition of the flexibility parameters used to compare the in vitro measurements with the FE predictions.
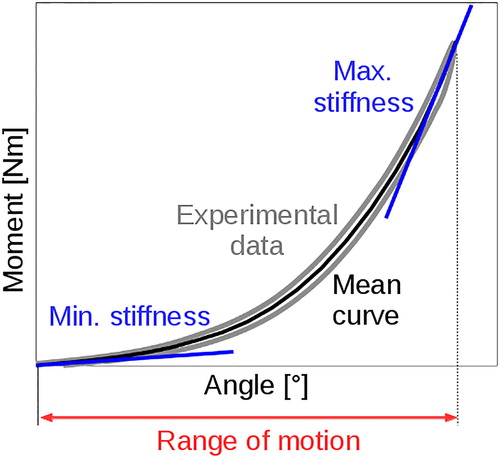
Figure 3. The geometry of the IVD was defined from the T1-weighted MR image (A). An multi-region Otsu threshold was first applied (B). The non-connected voxels and holes were then removed with morphological operations to generate the IVD mask (C). The same procedure was applied to the proton density-weighted MR image (D, E) to generate the NP mask (F). The IVD mask was used to create a tetrahedral mesh (G). The elements belonging to the NP mask were assigned the NP material properties, the others were assigned the AF material properties, including a fibre orientation based on the outer shape of the AF (H).
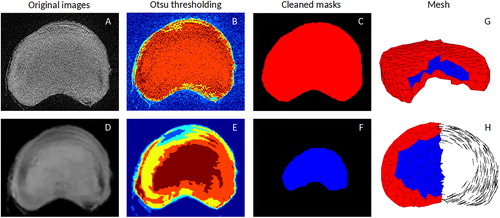
Figure 4. The FE model replicates the in vitro load-displacement curves. Black and gray represent the experimental data for the intact and damaged case, the dotted lines show the corresponding FE predictions.
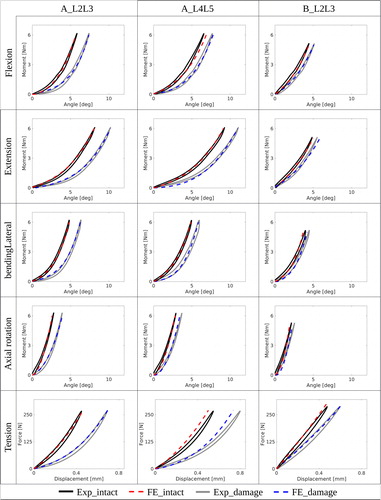
Figure 5. Mean relative difference in ROM, minimal stiffness and maximal stiffness between intact and denucleated samples at 6 Nm (270 N) for all loading cases for the experimental data (black) and FE predictions (blue).
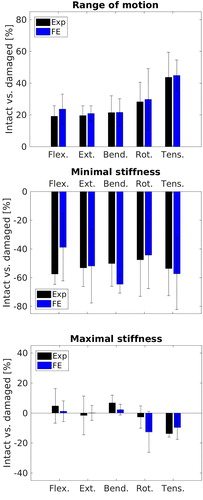
Table A1. S_max, S_min and ROM at 6 Nm (270 N) for intact and damaged discs, for all loading cases, experimental data and FE predictions.
Table 1. Material constants resulting from the calibration of the models with the in vitro load-displacement data. The index _i stands for intact and _d for the denucleated variables with μ_np the NP shear modulus, κ_np the NP bulk modulus, μ_af the AF shear modulus, κ_af the AF bulk modulus, k1 the fibre stiffness, k2 the fibre non-linearity, and ϕ fibre angle.
Table 2. Element size sensitivity. Native mean edge length is 3 mm, (−) corresponds to 2.5 mm mean edge length and (+) 3.5 mm mean edge length. All values are given in [%] change compared to the native element size.