
Figures & data
Figure 1. Comparison between Gen (red) and SubS (blue) model estimations of joint contact forces at observations M0 and M12. Black bars indicate region of gait cycle with significant statistical difference between the two models at P < 0.01.
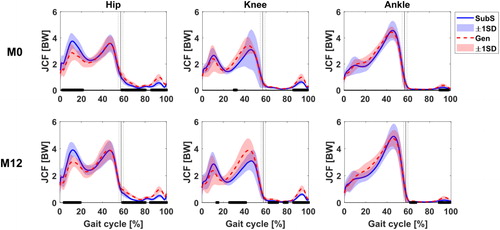
Table 1. Inter-model analysis of gait waveform profile at M0 and M12.
Figure 2. Boxplot distribution of P1 and P2 JCF estimates for scaled generic and subject-specific models at two observations, M0 and M12. * indicates significant difference at P < 0.05.
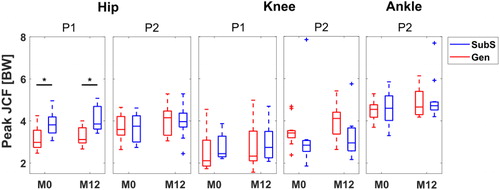
Figure 3. Boxplot distribution of overall joint loading estimates calculated as area under BW-normalised JCF curve. AUC expressed as BW*%Gait Cycle (BW.%c).
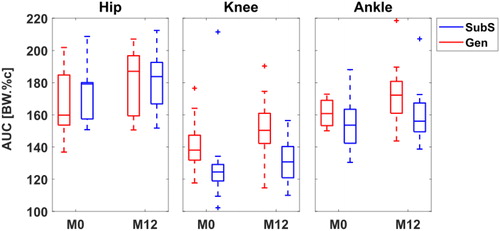
Table 2. Inter-model differences in participant estimates at M0.
Table 3. Inter-model differences in participant estimates at M12.
Table 4. Agreement in longitudinal changes (M12 - M0) in selected metrics between Gen and SubS predictions of JCF for each of 11 participants.
Figure A1 Different indices for the description and analysis of the simulation results. A: Goodness of fit was assessed with the RMSD. B: Joint loading during the loading response (P1) and push off (P2) phases were analysed using the peak values and overall joint loading by the area under JCF/BW curve.
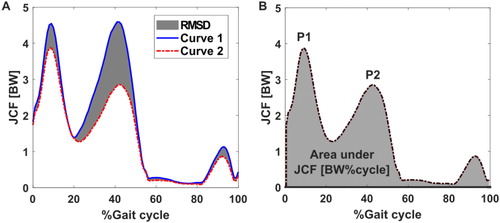
Figure A2 Comparison between Gen (red) and SubS (blue) model estimations of sagittal plane joint angles, moments and powers at all observations for 11 juvenile participants. Joint moments and powers normalised by body mass. Black bars indicate significance at P < 0.05 according to the non-parametric one-sample paired t-test. Extension/Flexion (Ext/Flex), Plantarflexion/Dorsiflexion (PF/DF) and Absorption/Generation (Abs/Gen).
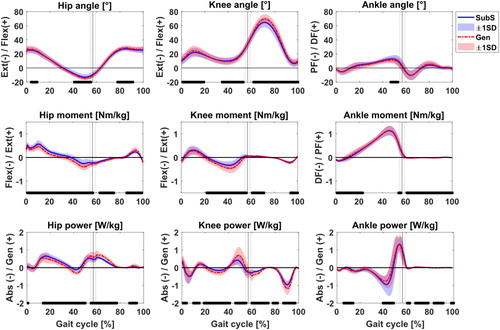
Figure A3. Muscle forces estimated by the Gen (red) and SubS (blue) models for 12 selected muscles at M0 and M12. Black bars indicate statistical significance at P < 0.05 between models. Selected muscles are biceps femoris long head, biceps femoris short head, gastrocnemius lateralis, gastrocnemius medialis, rectus femoris, semimembranosus, soleus, tibialis anterior, tibialis posterior, vastus intermedius, vastus lateralis and vastus medialis.
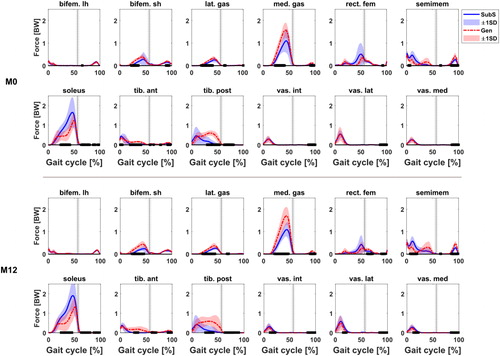
Table A1. p-values for Wilcoxon sign ranked test between M0 and M12 for Δm(RMSD).
Table A2. P-values for Wilcoxon sign ranked test between Gen and SubS for Δt(RMSD).
Table A3. p-values for Wilcoxon sign ranked test between Gen and SubS estimates of AUC(JCF).