Figures & data
Table 1. Relative segment lengths (to hand length) of each finger bone (distal phalanx (DP), middle phalanx (MP), proximal phalanx (PP), and metacarpal (MC)) in percent and corresponding standard deviation.
Figure 1. Visualization of all wrapping obstacles of the new hand model.
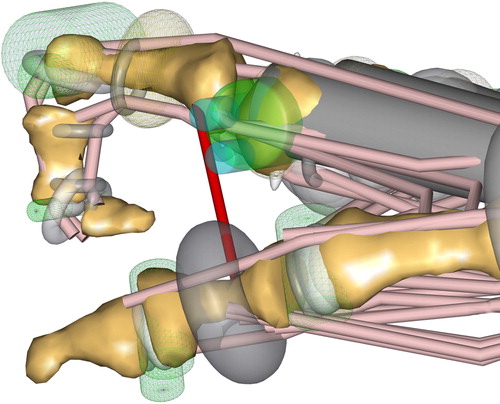
Figure 2. Detailed hand model with several representatives of one muscle (FPL) – left side. Hand model with only one representative for the same muscle – right side.
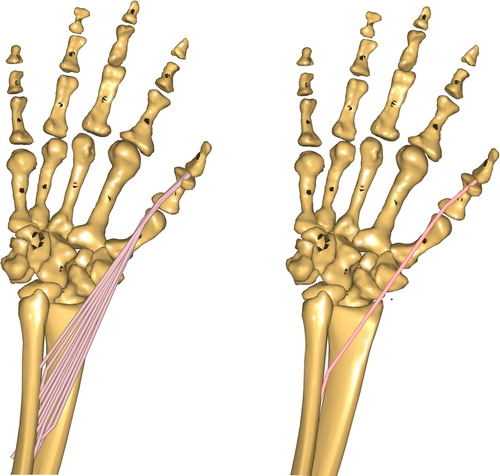
Figure 3. The proposed detailed musculoskeletal hand model in the AMS (configuration WRAP – SINGLE). The position of the fingers corresponds to the calibration position of ligaments to simulate the purlicue skin resistance (red).
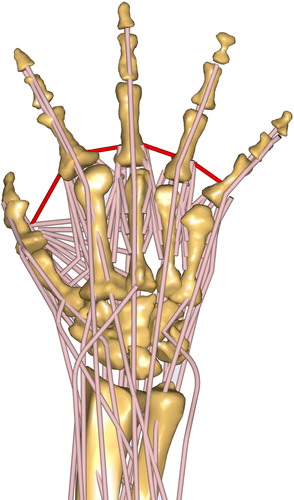
Table 2. Examined muscles according to the studies of Loren et al. (Citation1996), Smutz et al. (Citation1998) and An et al. (Citation1983)
Figure 4. Progression of the moment arms for the wrist regarding the extensor and flexor muscles during the extension/flexion phase. Negative angles represent the extension of the wrist, and positives the flexion. Lines represent the simulated results, whereas the shaded areas are the experimental results with standard deviation from Loren et al. (Citation1996).
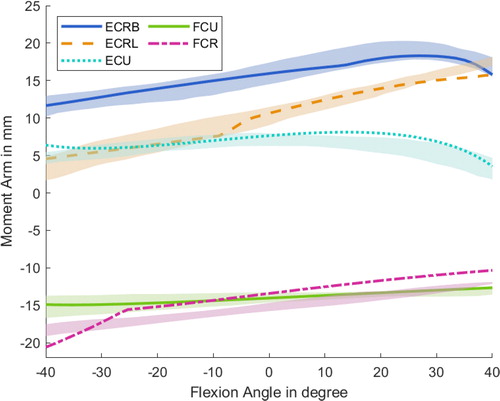
Figure 5. Progression of the moment arms for the index finger regarding extrinsic and intrinsic hand muscles during the flexion of the MCP joint. Lines represent the simulated results, whereas the shaded areas highlight the experimental data of one subject with standard deviation from An et al. (1983).
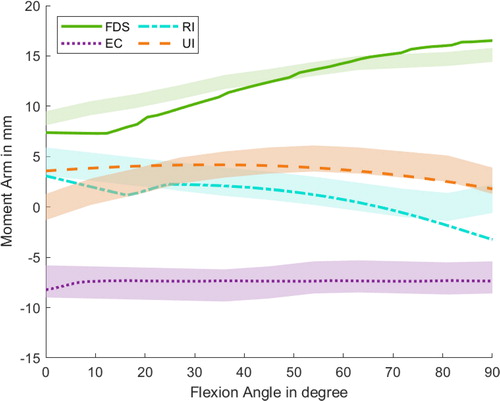
Figure 6. Progression of the moment arms for the thumb regarding extensor and flexor muscles during flexion around the CMC joint. Negative angles represent the extension of the CMC joint, and positives the flexion. Lines represent the simulated results, whereas the shaded areas highlight the experimental data with standard deviation from Smutz et al. (Citation1998).
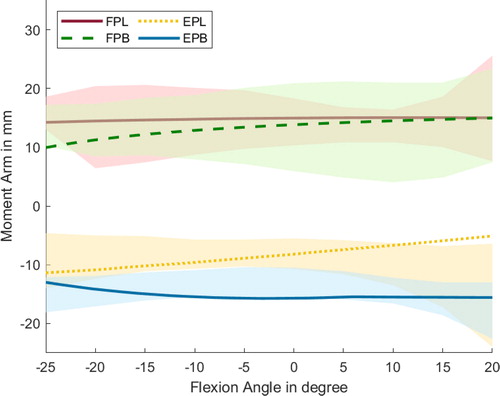
Table 3. Mean muscle moment arms of the index finger, thumb and wrist during the range of motion (extension/flexion, abduction/adduction).
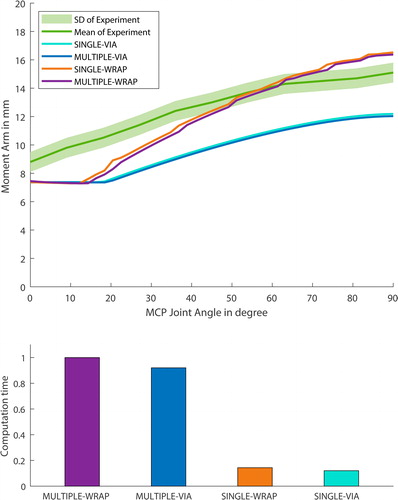
Figure 7. The progression (SINGLE)/ mean progression (MULTIPLE) of the FDS moment arms during flexion of the MCP index joint with different detailed stages of the model. Clearly notable is, that the model with obstacle methods predicts a better moment arm behaviour. The simple model drastically decreases the computational effort from 100 % (MULTIPLE-WRAP) to 14 % (MULTIPLE-VIA) and from 92 % (SINGLEWRAP) to 12 % (SINGLE-VIA).