Figures & data
Table 1. Kinematic constraint coefficients from Rozumalski et al. (Citation2008).
Figure 1. Musculoskeletal model of the lower limbs and lumbar spine with 538 musculotendon actuators.
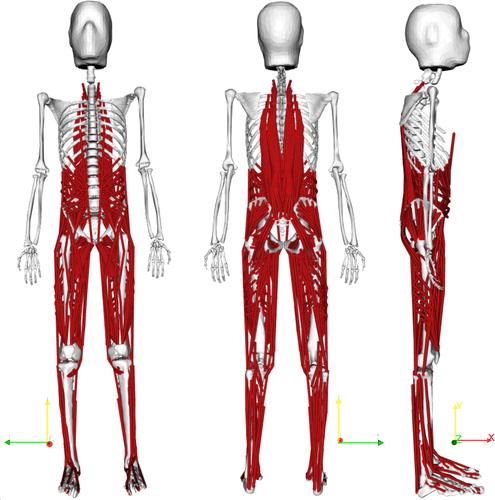
Figure 2. Location and orientation of the local lumbar vertebral coordinate systems, as defined by Pearcy and Bogduk (Citation1988).
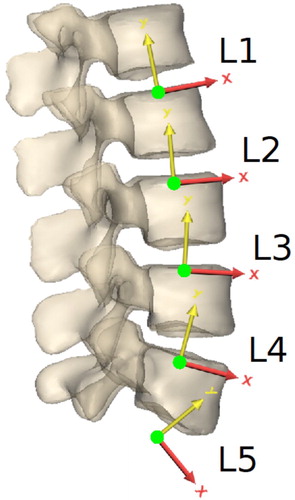
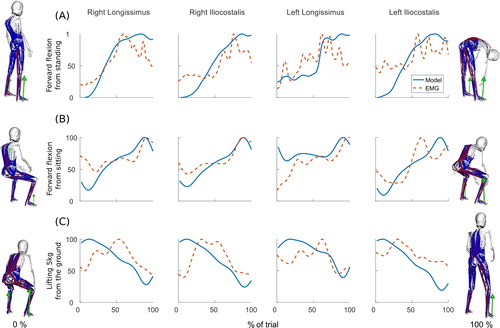
Table 2. Comparison between muscle activation predicted with the model and measured with sEMG on the right and left longissimus and iliocostalis of the same subject for the three activities shown in .
Figure 3. Model moment arms (in blue) at the lumbar joints for the erector spinae compared to experimental data (in red) reported by Jorgensen et al. (Citation2003). The shaded area is one standard deviation. The moment arms calculated with the mechanical approach are shown in green. Right and left side moment arms from the model were very similar so only the right side is shown here.
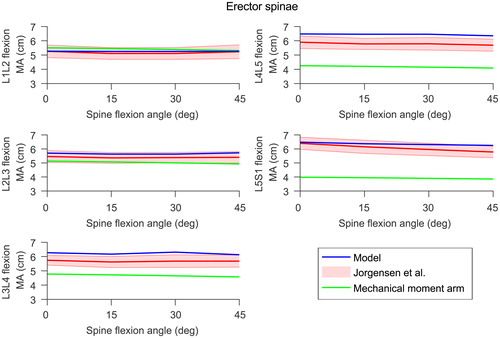
Figure 4. Maximum isometric extension moments at each lumbar level as a function of overall spine flexion.
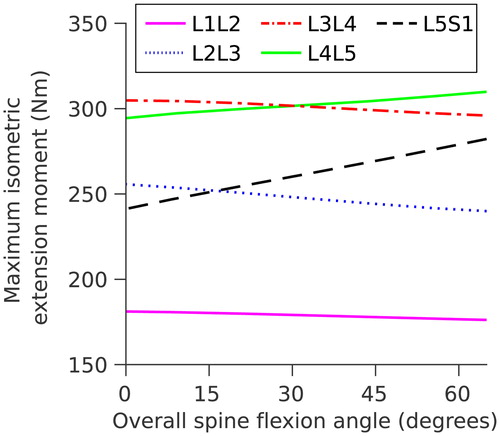
Figure 5. Comparison with measurements reported by Tafazzol et al. (Citation2014) for flexion angles with respect to the upright standing position for the thorax (T5), pelvis (S1) and lumbar spine (L1). Thorax and pelvis rotations are expressed in the global coordinate system while the lumbar rotation is expressed relative to the pelvis rotation. Error bars are the range reported by Tafazzol et al. (Citation2014).
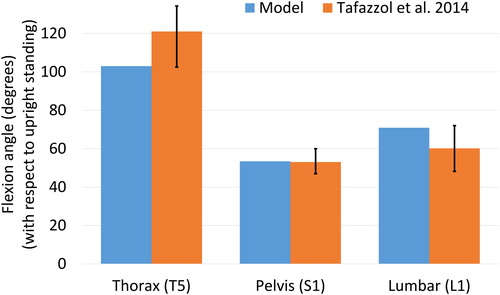
Figure 6. Comparison of the lumbopelvic ratio (lumbar angle/pelvic angle) with measurements reported by Tafazzol et al. (Citation2014) for 10% intervals of the full spine flexion. Error bars are the range reported by Tafazzol et al. (Citation2014).
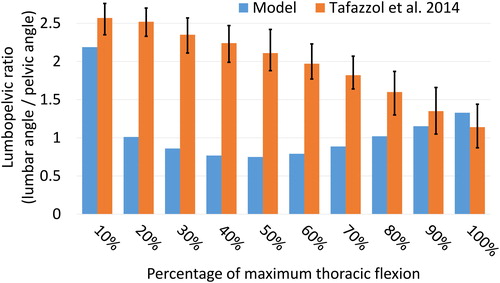
Figure 7. Total joint reaction force normalised to body weight at each lumbar level for static positions of the spine.
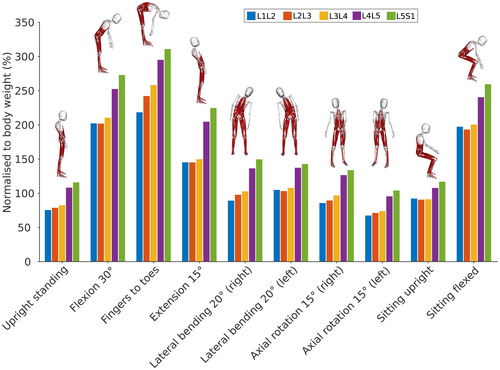
Figure 8. X (antero-posterior), Y (longitudinal) and Z (medio-lateral) components of the joint reaction force normalised to body weight at each lumbar level for static positions of the spine. Forces are expressed in the local vertebral coordinate systems shown in .
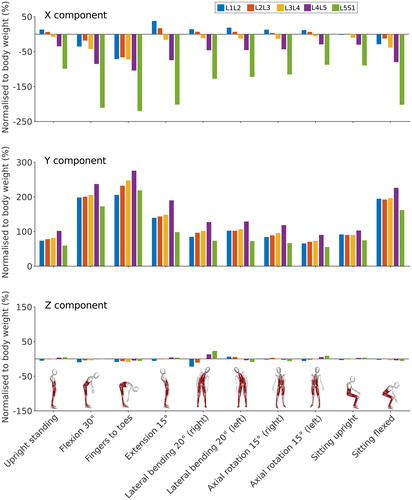
Figure 9. Comparison between in vivo intradiscal pressure (Nachemson Citation1965; Wilke et al. Citation1999, Citation2001; Sato et al. Citation1999; Takahashi et al. Citation2006) and joint reaction forces in the model at L4-L5 level. Error bars are one standard deviation for studies with more than one subject.
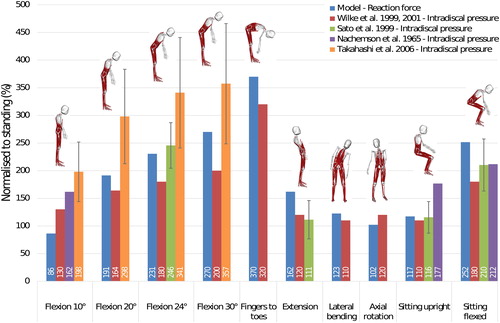
Figure 10. Comparison between in vivo intradiscal pressure measured by Schultz et al. (Citation1982) and joint reaction forces in the model at L3-L4 level.
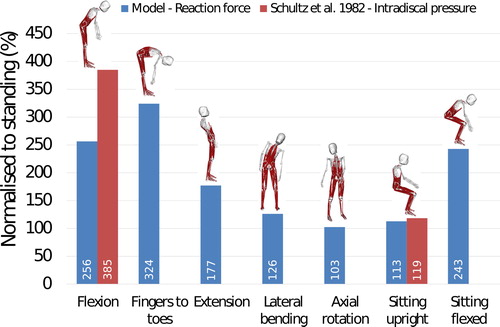
Figure 11. Comparison between in-vivo measured forces using the VBR implant (Rohlmann et al. Citation2008) and joint reaction forces in the model at L1-L2 level. Errors bars represent the range.
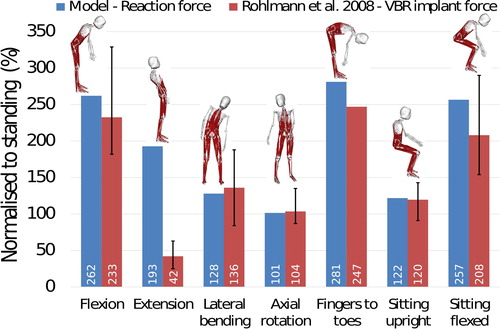
Figure 12. Model activations and sEMG activations for the right and left longissimus and iliocostalis during (A) a forward flexion of the spine from a standing upright position, (B) a forward flexion of the spine from a sitting upright position and (C) for lifting a 5 kg box from the ground to a standing upright position. Activations are normalised to the maximum activation over the activity. The stances at the beginning and end of each task are shown on the left and right of the graphs respectively.