
Figures & data
Figure 1. Block diagram of material point method.
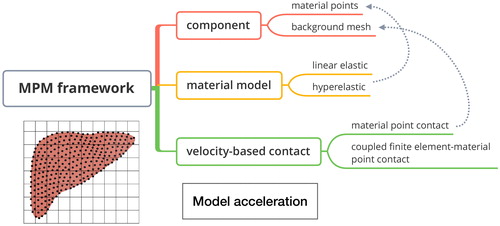
Figure 2. Overall algorithm flowchart of MPM.
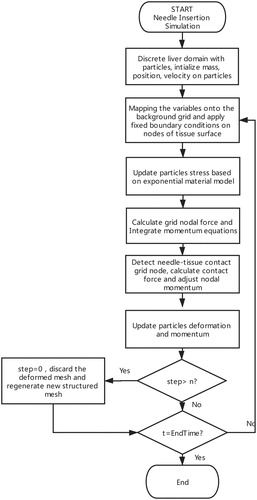
Figure 3. Contact point detection: needle points (represented as black points) and tissue points (represented as orange points) are mapped to the same background grid nodes (represented as yellow pentagram).
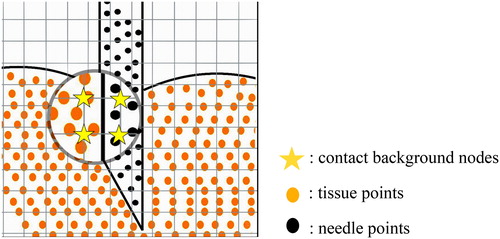
Figure 4. Normal and tangential vector of the needle surface.
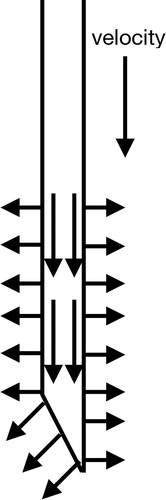
Figure 5. Schematic of the CFEMP based contact.
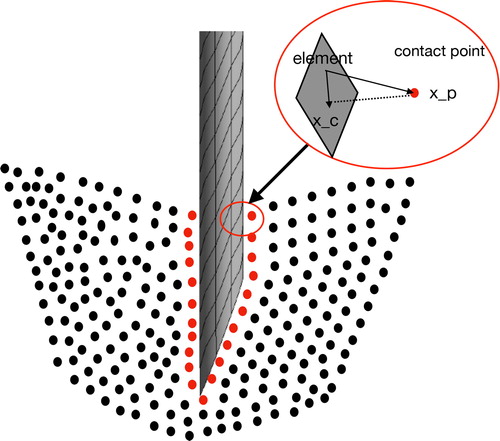
Figure 6. Numerical fracture in needle insertion: the distance between the surface tissue particles are enlarged in (a) and (b), numerical fracture occurs in (c).
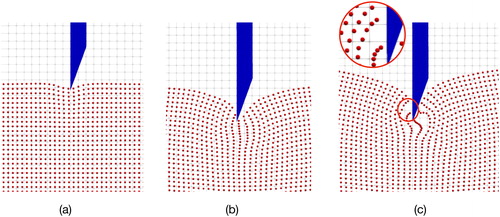
Figure 7. Compression Experiments of pork liver samples.
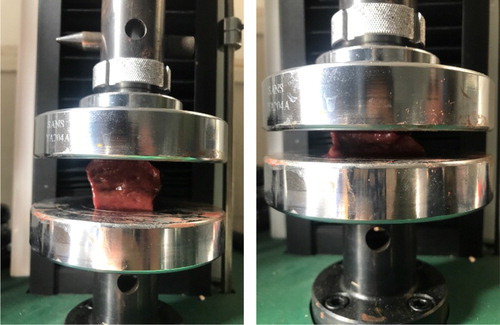
Figure 8. Relationship of strain and stress of pork livers.
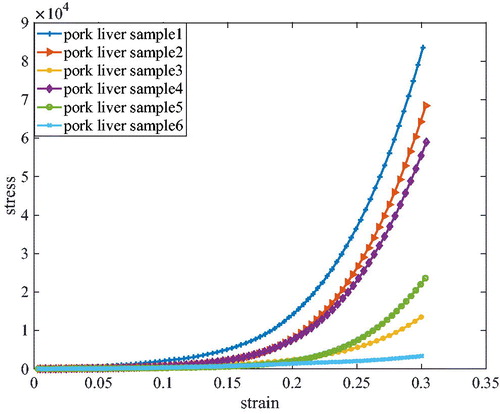
Figure 9. Comparison of exponential material model and experimental data of pork livers and PVA hydrogel.
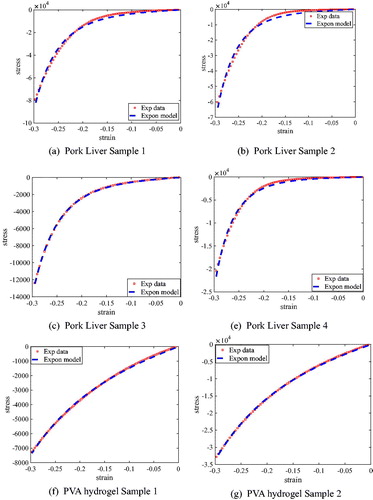
Table 1. Fitting parameters of exponential material model and residuals.
Figure 10. Experiment testbed of needle insertion into a phantom.
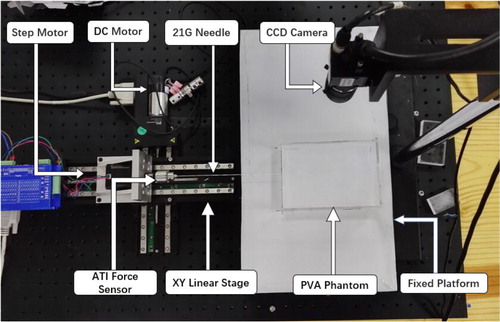
Table 2. PVA phantom parameters.
Figure 11. Markers distribution in the PVA phantom.
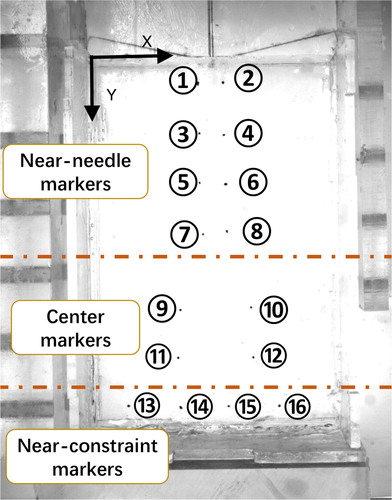
Figure 12. Visualization of global needle-tissue interaction based on MPM contact.
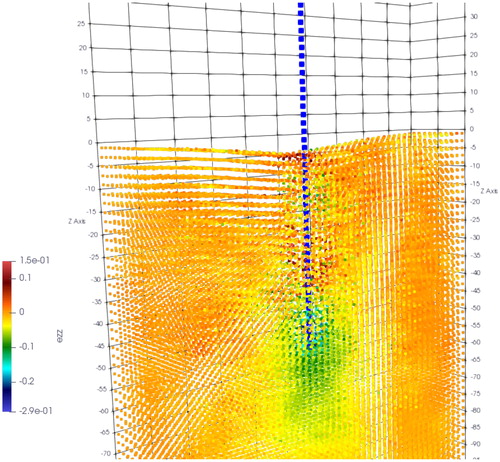
Figure 13. Comparison of MPM contact force and experimental measured force.
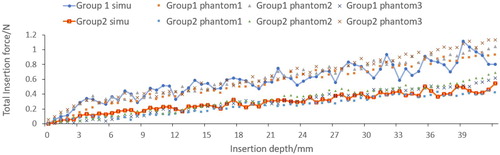
Figure 14. Visualization of local CFEMP contact: the maximum von Mises occurs at the needle tip.
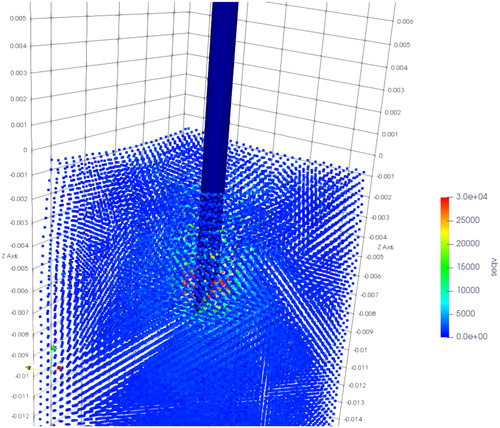
Figure 15. Comparison of CFEMP contact force and experimental measured force.
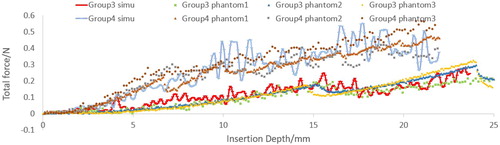
Table 3. Model accuracy evaluation of the MPM contact and CFEMP contact model.
Figure 16. Maximum absolute error and the mean absolute error of the resultant deformation.
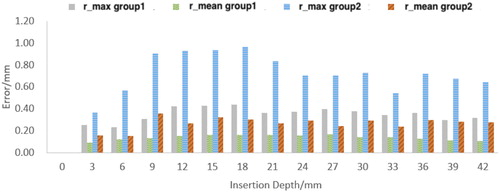
Table 4. Maximum absolute error and mean absolute error in xy direction (group 1).
Table 5. Maximum absolute error and mean absolute error in xy direction (group 2).