
Figures & data
Figure 1. Flow chart of model generation and material assignment. CBCT data is used to generate a tooth model of root resorption through software. The tooth model is then assembled with cortical bone, cancellous bone, and periodontal ligament models, and meshed to generate experimental models. b Material properties of cortical bone, cancellous bone, and periodontal ligament.
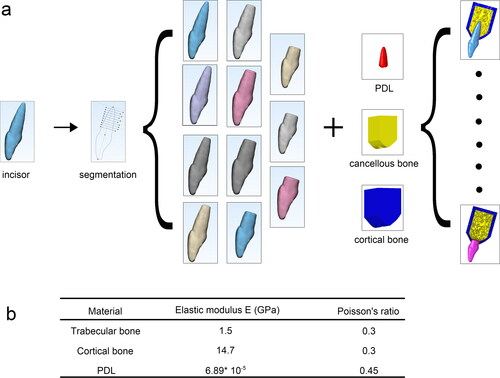
Figure 2. The stress distribution cloud diagram of the periodontal ligament of the maxillary central incisor with different root resorption lengths under the optimal intrusion force. The red area indicates that the stress is 4.7–12.8 kpa, which is the effective stress area, the gray area indicates that the stress is greater than 12.8 kpa, which is the ultimate stress area, and the other colors are low-stress areas. (In view of the size of the figure and other reasons, this diagram does not include all the stress distribution cloud of the periodontal ligament in this study. All the stress distribution cloud of the periodontal ligament can be found in Appendix )
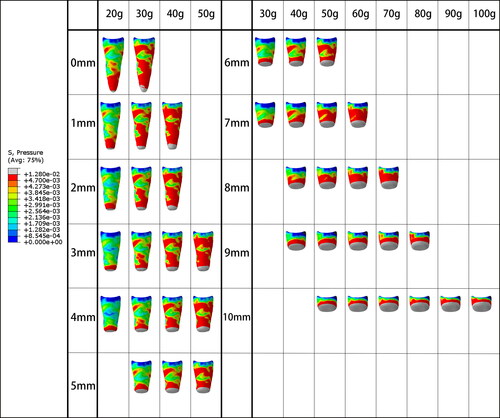
Figure 3. The strain distribution cloud diagram of the periodontal ligament of the maxillary central incisor with different root resorption lengths under the optimal intrusion force. The red and gray areas indicate that the strain is greater than 0.24%, which is the effective strain zone, and the other colors are the low strain zone. (Because of the size of the figure and the design and other reasons, this diagram does not include all the strain distribution cloud of the periodontal ligament in this study. All the strain distribution cloud of the periodontal ligament can be found in Appendix )
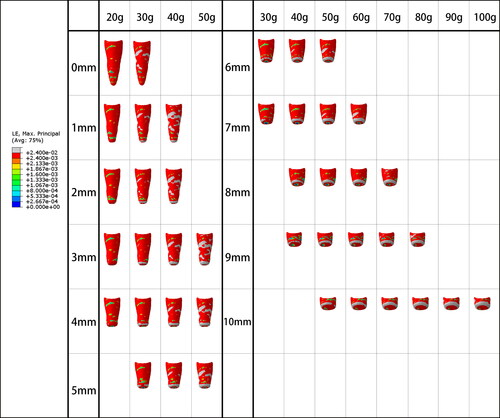
Figure 4. Curves of stress and strain areas of maxillary central incisors with different root resorption lengths under the action of intrusion force. The abscissa of the graph is the intrusion force value, and the ordinate is the area value. Each graph is composed of 5 curves. The magnified area is the intersection area of the curve where the upper and lower bounds of the optimal intrusion force are obtained.
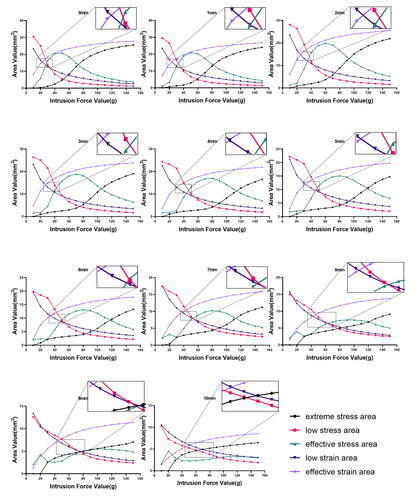
Figure 5. Diagram of the optimal intrusion force of the maxillary central incisor with different root resorption lengths. (a) Floating column chart of the optimal intrusion force for maxillary central incisors with different root resorption lengths. The upper and lower sides of the column represent the upper and lower bounds of the optimal intrusion force, and the length of the column represents the size of the optimal intrusion force interval. The middle of each column the point represents the median of the optimal intrusion force interval. (b) Curves of the median of optimal intrusion force of maxillary central incisors with different root resorption lengths. (c) When the maxillary central incisor with different root resorption length is subjected to an intrusion force that is the upper bound of the optimal intrusion force, the area bubble diagram of the extreme stress zone. The size of the bubble represents the percentage of the area of the extreme stress zone to the area of the periodontal ligament. The abscissa of the bubble center is the root resorption length, and the ordinate is the upper bound of the optimal intrusion force. (d) Comparison of the optimal intrusion force interval between the root resorption length of 0–6 mm and the root resorption length of 7 mm or more, the ordinate is the value of the optimal intrusion force interval (p < 0.05). (e) Comparing the median value of the optimal intrusion force between the root resorption length of 0–6 mm and the root resorption length of 7 mm or more, the ordinate is the median of the optimal intrusion force (p < 0.05). (f) Comparison of the percentage of the extreme stress area between the root resorption length of 0–6 mm and the root resorption length of 7 mm or more. The ordinate is when the intrusion force is equal to the upper bound of the optimal intrusion force, the area of the extreme stress area accounts for the percentage of the periodontal ligament area (p < 0.05).
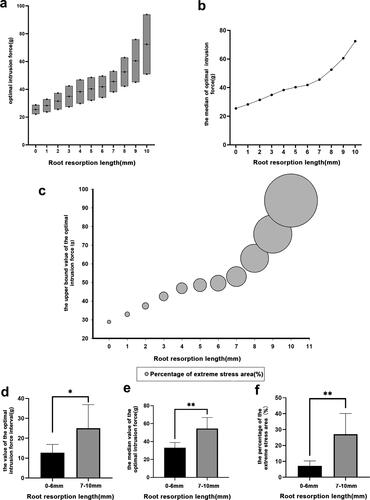
Table 1. Statistical Analysis of the Coefficients of Multiple Linear Regression Model
Figure A1. The strain distribution cloud diagram of the periodontal ligament of the maxillary central incisor with different root resorption lengths under the intrusion force. The red and gray areas indicate that the strain is greater than 0.24%, which is the effective strain zone, and the other colors are the low strain zone.
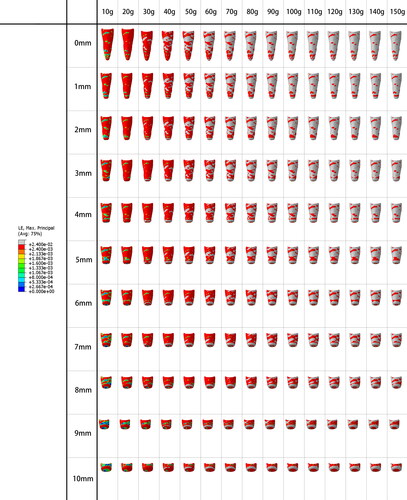
Figure A2. The stress distribution cloud diagram of the periodontal ligament of the maxillary central incisor with different root resorption lengths under the intrusion force. The red area indicates that the stress is 4.7–12.8 kpa, which is the effective stress area, the gray area indicates that the stress is greater than 12.8 kpa, which is the ultimate stress area, and the other colors are low-stress areas.
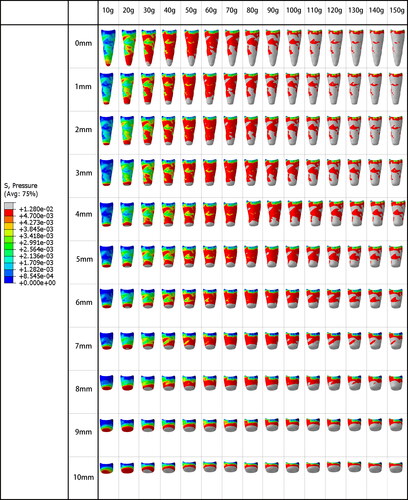
Figure A3. These three scatter plots, respectively, represent the value of the optimal intrusion force interval, the optimal intrusion force median, and the area percentage of the limit stress zone under different root resorption lengths.
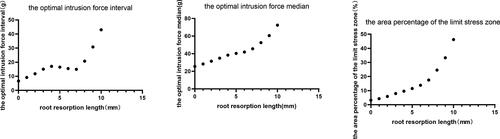
Figure A4. Residual analysis in three-term multiple linear regression analysis. The residual analysis was made to test whether these models are acceptable and valid. (A),(C),(E) show normal P-P plot of regression standardized residual. (B),(D),(F) represent scatter plots of regression studentized deleted (Press) residual under the regression standardized predicted value.
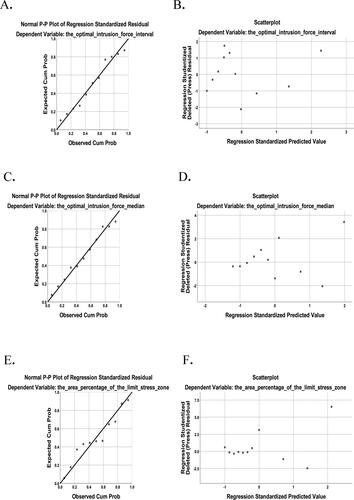
Figure A5. The stress and strain curves graphs of root absorption at 0 mm. 1 indicates the intersection of the effective strain area and the low strain area curves. 2 indicates the intersection of the low stress area and effective stress area curves.
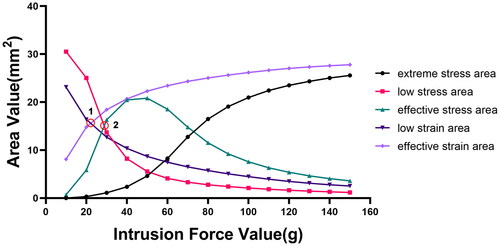
Table A1. Model summary.
Table A2. The value of for different root absorption lengths.