
Figures & data
Figure 1. The subject anatomy (left), scaled implant components (middle), and virtual fitting (right) is shown for the femur (top row) and the tibia (bottom row). Red dots on the right images show the location of the maximum OUH. Yellow plane illustrates the tibia bone resection plane.
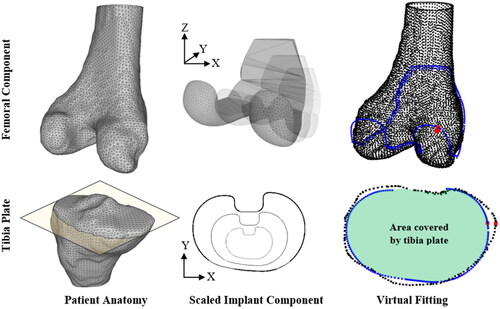
Figure 2. Tibia plate base designs ((A) anatomic, (B) symmetric). Red squares indicate the region of the tibia plate design not included in the fit analysis.
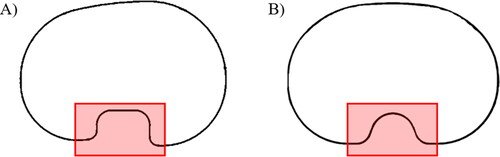
Figure 3. Population coverage at various thresholds when all possible component sizes considered for various design types. Maximum OUH (A) and RMSE (B).
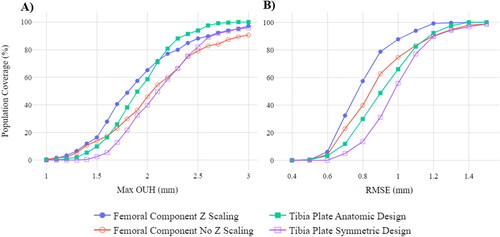
Figure 4. Box plot of femur component results with and without Z scaling.
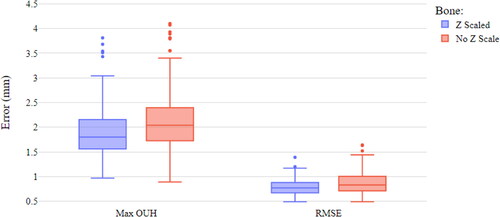
Figure 5. Box plot of tibia plate design results.
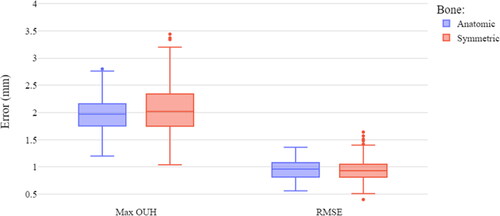
Figure 6. ML sizing (A) and ML/AP ratio (B) vs. AP sizing for genders and ethnicities, split by femur and tibia plate components.
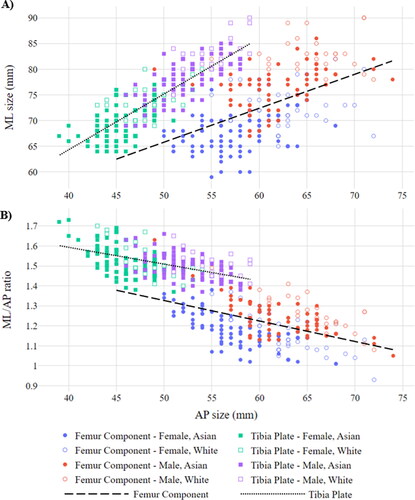
Figure 7. Population coverage (in terms of maximum OUH values of <3mm) for four femur component sizes with optimised spacing (A) and equal spacing (B).
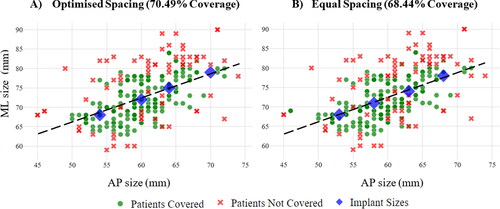
Figure 8. Population coverage (for various fit metrics) vs. number of femur component and tibia plate sizes for equal and optimised spacing.
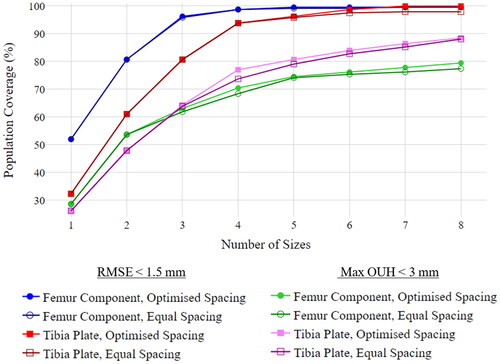
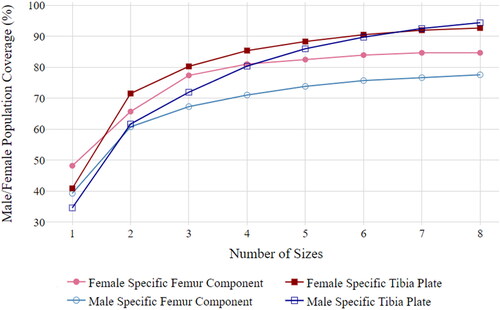
Figure 9. Male/female population coverage (in terms of maximum OUH values of <3mm) vs. number of femur component and tibia plate sizes for female and male-specific designs with optimised spacing.
Data availability statement
Access to the data used in this study can be requested by contacting the OAI and the KISTI.