
Figures & data
Figure 1. Schematic diagram of the 62 conductive pole cap electrode distribution and the 7 regions of interest of the brain analyser.
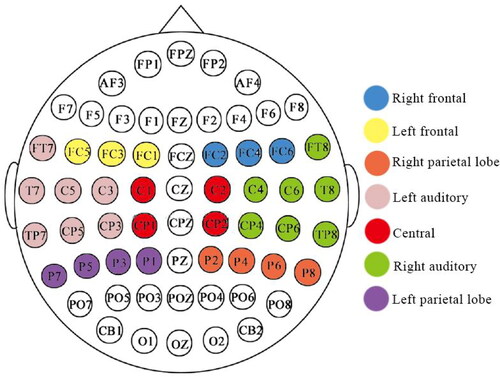
Table 2. Sample entropy values for the healthy group and tinnitus group.
Table 3. Mann-Whitney U test for the healthy group and tinnitus group for single channel.
Table 4. Mann-Whitney U test for the healthy group and tinnitus group.
Table 5. Classification accuracy, recall, precision and F1 score.
. Overview of the patients with tinnitus.