
Figures & data
Figure 1. (A) Schematic diagram of the inverted pendulum model. PL is the pendulum length; m is whole body mass; com is the vertical projection of COM on the ground plane; COP is the position of center of pressure. (B) The trajectory of COM and the position of COP for inverted pendulum walking in AP direction. SL is step length; orange straight lines, right leg in ground contact; blue straight lines, left leg in ground contact. copy0 is the position where the right foot contact with the ground; comy0 and vy0 are initial COM position and velocity, respectively (C) In ML direction, SW is step width; COPxL and COPxR are the positions where the right and left foot contact with the ground, respectively; comx0 and vx0 are initial COM position and velocity, respectively. (D) Xcom is the projection of XCOM on the ground plane, h is the height of XCOM, BOSb is BOS boundary, s is the line from XCOM to BOSb, θ is the angle between s and h, F is the minimum external force that makes the body unstable.
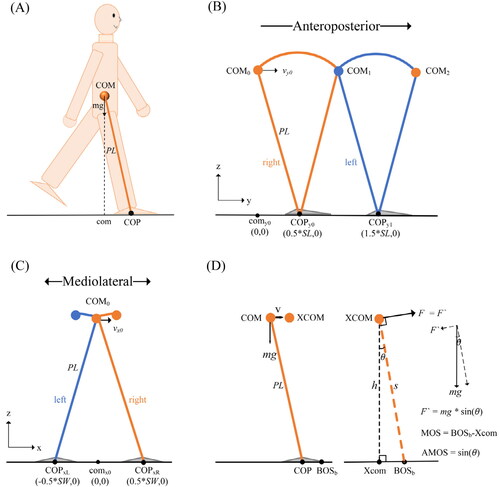
Figure 2. Positional relationship between COP and BOS boundary (BOSb) in foot model. COP is the projection of ankle joint center. (A) In ML direction, BOSb1 and BOSb2 are the left and right edges of the foot, respectively. (B) In AP direction, BOSb1 and BOSb2 are the lower and upper edges of the foot, respectively.
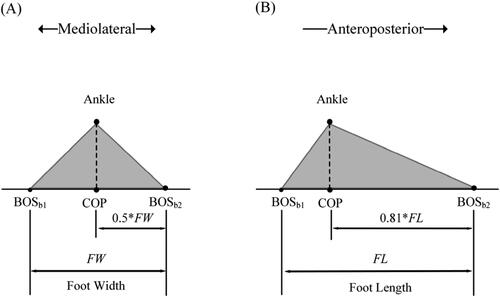
Figure 3. Schematic diagram of the normal arm swing (upper and lower limbs in the opposite phase), hold arms to the body (without arm swing), and anti-normal arm swing (upper and lower limbs in the same phase) during walking.
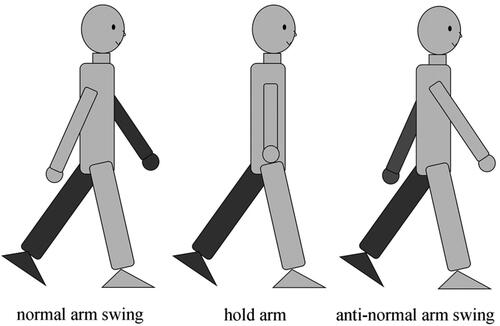
Figure 4. The shooting of a participant performed a walking trial in the gait analysis system. The participant was walking on the instrumented walkway and the Kinect was placed at the front of the participant.
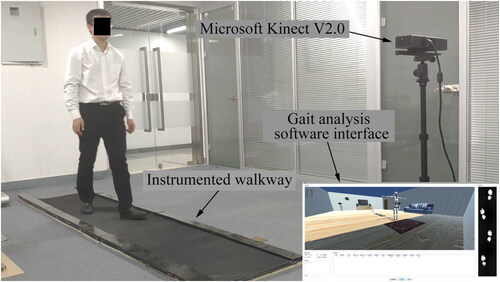
Figure 5. The relationship between MOS, AMOS and body height during normal gait in model simulation. (A) MOS in AP direction decreases with body height. (B) AMOS in AP direction remains unchanged with body height. (C) MOS in ML direction increases with body height. (D) AMOS in ML direction remains unchanged with body height.
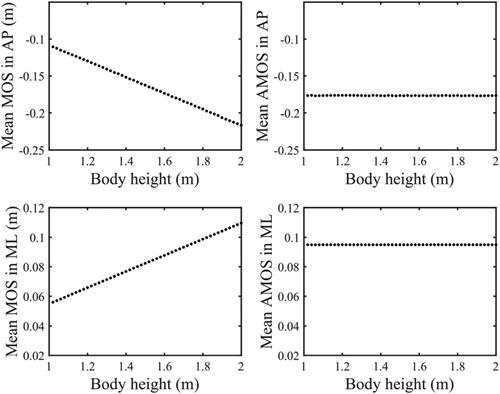
Table 1. Summary of the correlation analysis between MOS, AMOS, and body height in ML and AP directions under three different walking postures.
Figure 6. The acquired parameters (A) MOS, (B) AMOS were compared and analyzed among normal and abnormal walking postures in ML direction. Normal: walking with normal arm swing; Hold: hold arms (no arm swing); Anti: walking with anti-normal arm swing; *: significant differences (p < 0.05).
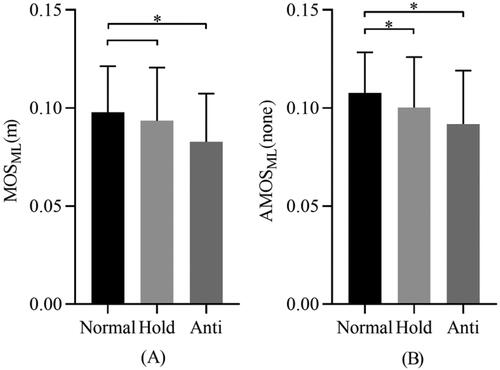
Table 2. Summary of the intra-group coefficient of variation in ML and AP directions under three different walking postures.
Table 3. Repeatability analysis over five repeated trials. Intra-class correlation coefficients (ICC1,1) and mean and standard deviation in ML and AP directions under three different walking postures.
Table 4. Summary of gait parameters under three different walking postures.